Download
1 / 75
750 likes | 765 Vues
This talk outlines Rick Field's journey in understanding hadron-hadron collisions, starting from the early days of Field-Feynman phenomenology to his work at CDF and CMS experiments. Topics include the underlying event, common plots, energy dependence, and the Fermilab Tevatron.

E N D
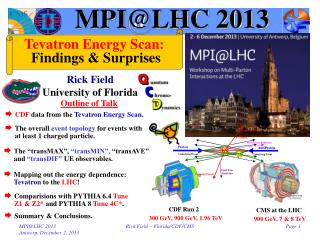
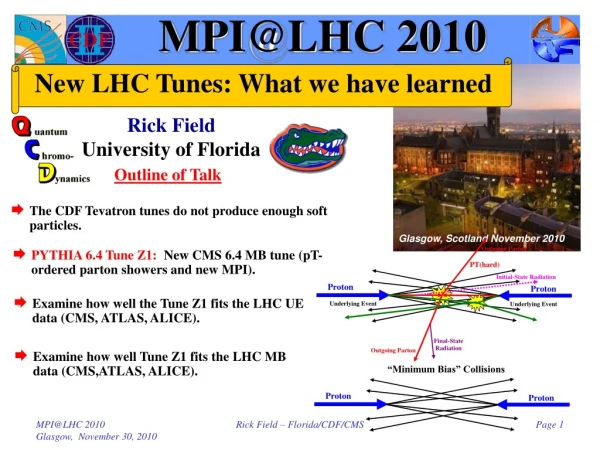
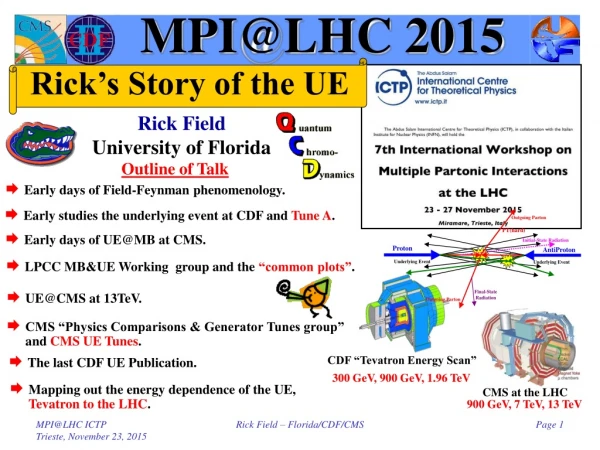
MPI@LHC 2015 Rick’s Story of the UE Rick Field University of Florida Outline of Talk • Early days of Field-Feynman phenomenology. • Early studies the underlying event at CDF and Tune A. • Early days of UE@MB at CMS. • LPCC MB&UE Working group and the “common plots”. • UE@CMS at 13TeV. • CMS “Physics Comparisons & Generator Tunes group” and CMS UE Tunes. CDF “Tevatron Energy Scan” • The last CDF UE Publication. 300 GeV, 900 GeV, 1.96 TeV • Mapping out the energy dependence of the UE, Tevatron to the LHC. CMS at the LHC 900 GeV, 7 TeV, 13 TeV Rick Field – Florida/CDF/CMS
Feynman-Field Phenomenology Toward and Understanding of Hadron-Hadron Collisions 1st hat! Feynman and Field • From 7 GeV/c p0’s to 1 TeV Jets. The early days of trying to understand and simulate hadron-hadron collisions. Rick Field – Florida/CDF/CMS
The Feynman-Field Days 1973-1983 • FF1: “Quark Elastic Scattering as a Source of High Transverse Momentum Mesons”, R. D. Field and R. P. Feynman, Phys. Rev. D15, 2590-2616 (1977). • FFF1: “Correlations Among Particles and Jets Produced with Large Transverse Momenta”, R. P. Feynman, R. D. Field and G. C. Fox, Nucl. Phys. B128, 1-65 (1977). • FF2: “A Parameterization of the properties of Quark Jets”, R. D. Field and R. P. Feynman, Nucl. Phys. B136, 1-76 (1978). • F1: “Can Existing High Transverse Momentum Hadron Experiments be Interpreted by Contemporary Quantum Chromodynamics Ideas?”, R. D. Field, Phys. Rev. Letters 40, 997-1000 (1978). • FFF2: “A Quantum Chromodynamic Approach for the Large Transverse Momentum Production of Particles and Jets”, R. P. Feynman, R. D. Field and G. C. Fox, Phys. Rev. D18, 3320-3343 (1978). “Feynman-Field Jet Model” • FW1: “A QCD Model for e+e- Annihilation”, R. D. Field and S. Wolfram, Nucl. Phys. B213, 65-84 (1983). My 1st graduate student! Rick Field – Florida/CDF/CMS
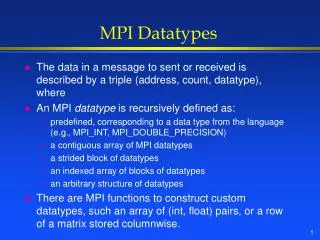
Hadron-Hadron Collisions FF1 1977 • What happens when two hadrons collide at high energy? Feynman quote from FF1 “The model we shall choose is not a popular one, so that we will not duplicate too much of the work of others who are similarly analyzing various models (e.g. constituent interchange model, multiperipheral models, etc.). We shall assume that the high PT particles arise from direct hard collisions between constituent quarks in the incoming particles, which fragment or cascade down into several hadrons.” • Most of the time the hadrons ooze through each other and fall apart (i.e.no hard scattering). The outgoing particles continue in roughly the same direction as initial proton and antiproton. • Occasionally there will be a large transverse momentum meson. Question: Where did it come from? • We assumed it came from quark-quark elastic scattering, but we did not know how to calculate it! “Black-Box Model” Rick Field – Florida/CDF/CMS
Quark-Quark Black-Box Model No gluons! FF1 1977 Quark Distribution Functions determined from deep-inelastic lepton-hadron collisions Feynman quote from FF1 “Because of the incomplete knowledge of our functions some things can be predicted with more certainty than others. Those experimental results that are not well predicted can be “used up” to determine these functions in greater detail to permit better predictions of further experiments. Our papers will be a bit long because we wish to discuss this interplay in detail.” Quark Fragmentation Functions determined from e+e- annihilations Quark-Quark Cross-Section Unknown! Deteremined from hadron-hadron collisions. Rick Field – Florida/CDF/CMS
Quark-Quark Black-Box Model FF1 1977 Predict increase with increasing CM energy W Predict particle ratios The beginning of the “underlying event”! “Beam-Beam Remnants” Predict overall event topology (FFF1 paper 1977) 7 GeV/c p0’s! Rick Field – Florida/CDF/CMS
QCD Approach: Quarks & Gluons Quark & Gluon Fragmentation Functions Q2 dependence predicted from QCD FFF2 1978 Feynman quote from FFF2 “We investigate whether the present experimental behavior of mesons with large transverse momentum in hadron-hadron collisions is consistent with the theory of quantum-chromodynamics (QCD) with asymptotic freedom, at least as the theory is now partially understood.” Parton Distribution Functions Q2 dependence predicted from QCD Quark & Gluon Cross-Sections Calculated from QCD Rick Field – Florida/CDF/CMS
The Fermilab Tevatron CDF “SciCo” Shift December 12-19, 2008 • I joined CDF in January 1998. My wife Jimmie on shift with me! Acquired 4728 nb-1 during 8 hour “owl” shift! Rick Field – Florida/CDF/CMS
Traditional Approach CDF Run 1 Analysis • Look at charged particle correlations in the azimuthal angle Df relative to a leading object (i.e. CaloJet#1, ChgJet#1, PTmax, Z-boson). For CDF PTmin = 0.5 GeV/c hcut = 1.0 or 0.8. Charged Particle Df Correlations PT > PTmin |h| < hcut Leading Calorimeter Jet or Leading Charged Particle Jet or Leading Charged Particle or Z-Boson “Transverse” region very sensitive to the “underlying event”! • Define |Df| < 60o as “Toward”, 60o < |Df| < 120o as “Transverse”, and |Df| > 120o as “Away”. • All three regions have the same area in h-f space, Dh×Df = 2hcut×120o = 2hcut×2p/3. Construct densities by dividing by the area in h-f space. Rick Field – Florida/CDF/CMS
ISAJET 7.32 (without MPI)“Transverse” Density ISAJET uses a naïve leading-log parton shower-model which does not agree with the data! • Plot shows average “transverse” charge particle density (|h|<1, pT>0.5 GeV) versus PT(charged jet#1) compared to the QCD hard scattering predictions of ISAJET 7.32 (default parameters with PT(hard)>3 GeV/c) . • The predictions of ISAJET are divided into two categories: charged particles that arise from the break-up of the beam and target (beam-beam remnants); and charged particles that arise from the outgoing jet plus initial and final-state radiation(hard scattering component). ISAJET “Hard” Component February 25, 2000 Beam-Beam Remnants Rick Field – Florida/CDF/CMS
HERWIG 6.4 (without MPI)“Transverse” Density • Plot shows average “transverse” charge particle density (|h|<1, pT>0.5 GeV) versus PT(charged jet#1) compared to the QCD hard scattering predictions of HERWIG 5.9(default parameters with PT(hard)>3 GeV/c without MPI). • The predictions of HERWIG are divided into two categories: charged particles that arise from the break-up of the beam and target (beam-beam remnants); and charged particles that arise from the outgoing jet plus initial and final-state radiation(hard scattering component). HERWIG “Hard” Component Beam-Beam Remnants Rick Field – Florida/CDF/CMS
Tuning PYTHIA 6.2:Multiple Parton Interaction Parameters Hard Core Determines the energy dependence of the MPI! Determine by comparing with 630 GeV data! Affects the amount of initial-state radiation! Take E0 = 1.8 TeV Reference point at 1.8 TeV Rick Field – Florida/CDF/CMS
PYTHIA 6.206 Defaults MPI constant probability scattering • Plot shows the “Transverse” charged particle density versus PT(chgjet#1) compared to the QCD hard scattering predictions of PYTHIA 6.206 (PT(hard) > 0) using the default parameters for multiple parton interactions and CTEQ3L, CTEQ4L, and CTEQ5L. PYTHIA default parameters Default parameters give very poor description of the “underlying event”! Note Change PARP(67) = 4.0 (< 6.138) PARP(67) = 1.0 (> 6.138) Rick Field – Florida/CDF/CMS
Run 1 PYTHIA Tune A CDF Default Feburary 25, 2000! • Plot shows the “transverse” charged particle density versus PT(chgjet#1) compared to the QCD hard scattering predictions of two tuned versions of PYTHIA 6.206 (CTEQ5L, Set B (PARP(67)=1)andSet A(PARP(67)=4)). PYTHIA 6.206 CTEQ5L Run 1 Analysis Old PYTHIA default (more initial-state radiation) Old PYTHIA default (more initial-state radiation) New PYTHIA default (less initial-state radiation) New PYTHIA default (less initial-state radiation) Rick Field – Florida/CDF/CMS
“Transverse” Charged DensitiesEnergy Dependence Rick Field Fermilab MC Workshop October 4, 2002! Increasing e produces less energy dependence for the UE resulting in less UE activity at the LHC! Lowering PT0 at 630 GeV (i.e. increasing e) increases UE activity resulting in less energy dependence. • Shows the “transverse” charged PTsum density (|h|<1, PT>0.4 GeV) versus PT(charged jet#1) at 630 GeV predicted by HERWIG 6.4 (PT(hard) > 3 GeV/c, CTEQ5L) and a tuned version of PYTHIA 6.206 (PT(hard) > 0, CTEQ5L, Set A, e = 0, e = 0.16 (default) and e = 0.25 (preferred)). • Also shown are the PTsum densities (0.16 GeV/c and 0.54 GeV/c) determined from the Tano, Kovacs, Huston, and Bhatti “transverse” cone analysis at 630 GeV. Reference point E0 = 1.8 TeV Rick Field – Florida/CDF/CMS
Early Studies of the UE DPF 2000: My first presentation on the “underlying event”! First CDF UE Studies Rick Field Wine & Cheese Talk October 4, 2002 Rick Field – Florida/CDF/CMS
My First Talk on the UE Need to “tune” the QCD MC models! My first look at the “underlying event plateau”! Rick Field – Florida/CDF/CMS
Other Early UE Talks Workshop on Physics at TeV Colliders, Les Houches, May 30, 2001. Cambridge Workshop on TeV-Scale Physics, July 20, 2002. HERA and the LHC Workshop, CERN, October 11, 2004. Rick Field – Florida/CDF/CMS
KITP Collider Workshop 2004 Together with Torbjörn Sjöstrand and his graduate student Peter Skands! Rick Field – Florida/CDF/CMS
AVE “transverse” (Trans 1 + Trans 2)/2 1 charged particle in the “transverse 2” region dNchg/dhdf = 1/(4p/6) = 0.48 “Transverse”Particle Densities • Study the charged particles (pT > 0.5 GeV/c, |h| < 1) in the “Transverse 1” and “Transverse 2” and form the charged particle density, dNchg/dhdf, and the charged scalar pT sum density, dPTsum/dhdf. Charged Particles pT > 0.5 GeV/c |h| < 1 Area = 4p/6 • The average “transverse” density is the average of “transverse 1” and “transverse 2”. Rick Field – Florida/CDF/CMS
Leading Jet Charged Particle DensityDf Dependence • Shows the Df dependence of the charged particle density, dNchg/dhdf, for charged particles in the range pT > 0.5 GeV/c and |h| < 1 relative to jet#1 (rotated to 270o) for “leading jet” events 30 < ET(jet#1) < 70 GeV. Log Scale! Min-Bias 0.25 per unit h-f • Also shows charged particle density, dNchg/dhdf, for charged particles in the range pT > 0.5 GeV/c and |h| < 1 for “min-bias” collisions. Rick Field – Florida/CDF/CMS
Charged Particle DensityDf Dependence • Look at the “transverse” region as defined by the leading jet (JetClu R = 0.7, |h| < 2) or by the leading two jets (JetClu R = 0.7, |h| < 2). “Back-to-Back” events are selected to have at least two jets with Jet#1 and Jet#2 nearly “back-to-back” (Df12 > 150o) with almost equal transverse energies (ET(jet#2)/ET(jet#1) > 0.8). Refer to this as a “Leading Jet” event Subset Refer to this as a “Back-to-Back” event • Shows the Df dependence of the charged particle density, dNchg/dhdf, for charged particles in the range pT > 0.5 GeV/c and |h| < 1 relative to jet#1 (rotated to 270o) for 30 < ET(jet#1) < 70 GeV for “Leading Jet” and “Back-to-Back” events. Rick Field – Florida/CDF/CMS
0.5 1.0 1.5 2.0 Charged Particle DensityDf Dependence “Leading Jet” “Back-to-Back” Polar Plot • Shows the Df dependence of the charged particle density, dNchg/dhdf, for charged particles in the range pT > 0.5 GeV/c and |h| < 1 relative to jet#1 (rotated to 270o) for 30 < ET(jet#1) < 70 GeV for “Leading Jet” and “Back-to-Back” events. Rick Field – Florida/CDF/CMS
“Transverse” PTsum DensityPYTHIA Tune A vs HERWIG “Leading Jet” “Back-to-Back” Now look in detail at “back-to-back” events in the region 30 < ET(jet#1) < 70 GeV! • Shows the average charged PTsum density, dPTsum/dhdf, in the “transverse” region (pT > 0.5 GeV/c, |h| < 1) versus ET(jet#1) for “Leading Jet” and “Back-to-Back” events. • Compares the (uncorrected) data with PYTHIA Tune A and HERWIG (no MPI) after CDFSIM. Rick Field – Florida/CDF/CMS
Charged PTsum DensityPYTHIA Tune A vs HERWIG HERWIG (without multiple parton interactions) does not produces enough PTsum in the “transverse” region for 30 < ET(jet#1) < 70 GeV! Rick Field – Florida/CDF/CMS
Back-to-Back “Associated”Charged Particle Densities Maximum pT particle in the “transverse” region! “Associated” densities do not include PTmaxT! • Use the leading jet in “back-to-back” events to define the “transverse” region and look at the maximum pT charged particle in the “transverse” region, PTmaxT. • Look at the Df dependence of the “associated” charged particle and PTsum densities, dNchg/dhdf and dPTsum/dhdf for charged particles (pT > 0.5 GeV/c, |h| < 1, not including PTmaxT) relative to PTmaxT. • Rotate so that PTmaxT is at the center of the plot (i.e. 180o). Rick Field – Florida/CDF/CMS
Back-to-Back “Associated”Charged Particle Density “Associated” densities do not include PTmaxT! Jet#2 Region ?? Log Scale! • Look at the Df dependence of the “associated” charged particle density, dNchg/dhdf for charged particles (pT > 0.5 GeV/c, |h| < 1, not including PTmaxT) relative to PTmaxT (rotated to 180o) for PTmaxT > 0.5 GeV/c, PTmaxT > 1.0 GeV/c and PTmaxT > 2.0 GeV/c, for “back-to-back” events with 30 < ET(jet#1) < 70 GeV. • Shows “jet structure” in the “transverse” region (i.e.the “birth” of the 3rd & 4th jet). Rick Field – Florida/CDF/CMS
0.5 1.0 1.5 2.0 Back-to-Back “Associated”Charged Particle Densities “Back-to-Back” charge density “Back-to-Back” “associated” density Polar Plot • Shows the Df dependence of the “associated” charged particle density, dNchg/dhdf, pT > 0.5 GeV/c, |h| < 1 (not including PTmaxT) relative to PTmaxT (rotated to 180o) and the charged particle density, dNchg/dhdf, pT > 0.5 GeV/c, |h| < 1 relative to jet#1 (rotated to 270o) for “back-to-back events” with 30 < ET(jet#1) < 70 GeV. Rick Field – Florida/CDF/CMS
0.5 1.0 1.5 2.0 Back-to-Back “Associated”Charged Particle Densities “Back-to-Back” charge density “Back-to-Back” “associated” density Polar Plot • Shows the Df dependence of the “associated” charged particle density, dNchg/dhdf, pT > 0.5 GeV/c, |h| < 1, PTmaxT > 2.0 GeV/c (not including PTmaxT) relative to PTmaxT (rotated to 180o) and the charged particle density, dNchg/dhdf, pT > 0.5 GeV/c, |h| < 1, relative to jet#1 (rotated to 270o) for “back-to-back events” with 30 < ET(jet#1) < 70 GeV. Rick Field – Florida/CDF/CMS
Back-to-Back “Associated”Charged Particle Density Jet#2 Region Log Scale! • Look at the Df dependence of the “associated” charged particle density, dNchg/dhdf, pT > 0.5 GeV/c, |h| < 1 (not including PTmaxT) relative to PTmaxT (rotated to 180o) for PTmaxT > 2.0 GeV/c for “back-to-back” events with 30 < ET(jet#1) < 70 GeV and 95 < ET(jet#1) < 130 GeV. • Very little dependence on ET(jet#1) in the “transverse” region for “back-to-back” events! Rick Field – Florida/CDF/CMS
“Associated” PTsum DensityPYTHIA Tune A vs HERWIG HERWIG (without multiple parton interactions) does not produce enough “associated” PTsum in the direction of PTmaxT! PTmaxT > 0.5 GeV/c And HERWIG (without multiple parton interactions) does not produce enough PTsum in the direction opposite of PTmaxT! Rick Field – Florida/CDF/CMS
For PTmaxT > 2.0 GeV both PYTHIA and HERWIG produce slightly too much “associated” PTsum in the direction of PTmaxT! “Associated” PTsum DensityPYTHIA Tune A vs HERWIG PTmaxT > 2 GeV/c But HERWIG (without multiple parton interactions) produces too few particles in the direction opposite of PTmaxT! Rick Field – Florida/CDF/CMS
0.5 1.0 1.5 2.0 Jet Topologies QCD Four Jet Topology QCD Three Jet Topology Polar Plot • Shows the Df dependence of the “associated” charged particle density, dNchg/dhdf, pT > 0.5 GeV/c, |h| < 1, PTmaxT > 2.0 GeV/c (not including PTmaxT) relative to PTmaxT (rotated to 180o) and the charged particle density, dNchg/dhdf, pT > 0.5 GeV/c, |h| < 1, relative to jet#1 (rotated to 270o) for “back-to-back events” with 30 < ET(jet#1) < 70 GeV. Rick Field – Florida/CDF/CMS
Jet Multiplicity • Shows the data on the number of jets (JetClu, R = 0.7, |h| < 2, ET(jet) > 3 GeV) for “back-to-back” events with 30 < ET(jet#1) < 70 GeV andPTmaxT > 2.0 GeV/c. Max pT in the “transverse” region! HERWIG (without multiple parton interactions) does not have equal amounts of 3 and 4 jet topologies! Data have about equal amounts of 3 and 4 jet topologies! • Compares the (uncorrected) data with PYTHIA Tune A after CDFSIM. • Compares the (uncorrected) data with HERWIG (no MPI) after CDFSIM. Rick Field – Florida/CDF/CMS
Tuned JIMMY versusPYTHIA Tune A JIMMY tuned to agree with PYTHIA Tune A! Jon Butterworth Jeff Forshaw Mike Seymour • (left) Shows the Run 2 data on the Df dependence of the charged scalar PTsum density (|h|<1, pT>0.5 GeV/c) relative to the leading jet for 30 < ET(jet#1) < 70 GeV/c compared with PYTHIA Tune A (after CDFSIM). • (right) Shows the generator level predictions of PYTHIA Tune A and a tuned version of JIMMY (PTmin=1.8 GeV/c) for the Df dependence of the charged scalar PTsum density (|h|<1, pT>0.5 GeV/c) relative to the leading jet for PT(jet#1) > 30 GeV/c. The tuned JIMMY and PYTHIA Tune A agree in the “transverse” region. • (right) For JIMMY the contributions from the multiple parton interactions (MPI), initial-state radiation (ISR), and the 2-to-2 hard scattering plus finial-state radiation (2-to-2+FSR) are shown. Rick Field – Florida/CDF/CMS
Proton Proton The New Forefront • The forefront of science is moving from the US to CERN (Geneva, Switzerland). 13 TeV • The LHC is designed to collide protons with protons at a center-of-mass energy of 14 TeV (seven times greater energy than Fermilab)! Rick Field – Florida/CDF/CMS
Min-Bias “Associated”Charged Particle Density • Shows the “associated” charged particle density in the “transverse” region as a function of PTmax for charged particles (pT > 0.5 GeV/c, |h| < 1, not including PTmax) for “min-bias” events at 0.2 TeV, 1.96 TeV and 14 TeVpredicted by PYTHIA Tune DW at the particle level (i.e. generator level). ~1.9 ~2.7 0.2 TeV → 1.96 TeV (UE increase ~2.7 times) 1.96 TeV → 14 TeV (UE increase ~1.9 times) RHIC LHC Tevatron Rick Field – Florida/CDF/CMS
1st Workshop on Energy Scalingin Hadron-Hadron Collisions Peter Skands! Renee Fatemi gave a talk on the “underlying event at STAR! “On the Boarder” restaurant, Aurora, IL April 27, 2009 Rick Field – Florida/CDF/CMS
The “Underlying Event” at STAR • At STAR they have measured the “underlying event at W = 200 GeV (|h| < 1, pT > 0.2 GeV) and compared their uncorrected data with PYTHIA Tune A + STAR-SIM. Rick Field – Florida/CDF/CMS
Min-Bias “Associated”Charged Particle Density • Shows the “associated” charged particle density in the “transverse” region as a function of PTmax for charged particles (pT > 0.5 GeV/c, |h| < 1, not including PTmax) for “min-bias” events at 0.2 TeV, 0.9 TeV, 1.96 TeV, 7 TeV, 10 TeV, 14 TeVpredicted by PYTHIA Tune DW at the particle level (i.e. generator level). LHC14 LHC10 LHC7 Tevatron 900 GeV RHIC 0.2 TeV → 1.96 TeV (UE increase ~2.7 times) 1.96 TeV → 14 TeV (UE increase ~1.9 times) RHIC LHC Tevatron Linear scale! Rick Field – Florida/CDF/CMS
Min-Bias “Associated”Charged Particle Density • Shows the “associated” charged particle density in the “transverse” region as a function of PTmax for charged particles (pT > 0.5 GeV/c, |h| < 1, not including PTmax) for “min-bias” events at 0.2 TeV, 0.9 TeV, 1.96 TeV, 7 TeV, 10 TeV, 14 TeVpredicted by PYTHIA Tune DW at the particle level (i.e. generator level). LHC14 LHC10 LHC7 Tevatron 900 GeV RHIC 7 TeV → 14 TeV (UE increase ~20%) LHC7 LHC14 Linear on a log plot! Log scale! Rick Field – Florida/CDF/CMS
UE&MB@CMS Initial Group Members Rick Field (Florida) Darin Acosta (Florida) Paolo Bartalini (Florida) Albert De Roeck (CERN) Livio Fano' (INFN/Perugia at CERN) Filippo Ambroglini (INFN/Perugia at CERN) Khristian Kotov (UF Student, Acosta) PTDR Volume 2 Section 3.3.2 • Measure Min-Bias and the “Underlying Event” at CMS • The plan involves two phases. • Phase 1 would be to measure min-bias and the “underlying event” as soon as possible (when the luminosity is low), perhaps during commissioning. We would then tune the QCD Monte-Carlo models for all the other CMS analyses. Phase 1 would be a service to the rest of the collaboration. As the measurements become more reliable we would re-tune the QCD Monte-Carlo models if necessary and begin Phase 2. • Phase 2 is “physics” and would include comparing the min-bias and “underlying event” measurements at the LHC with the measurements we have done (and are doing now) at CDF and then writing a physics publication. Perugia, Italy, March 2006 UE&MB@CMS Florida-Perugia-CERN University of Perugia Rick Field – Florida/CDF/CMS
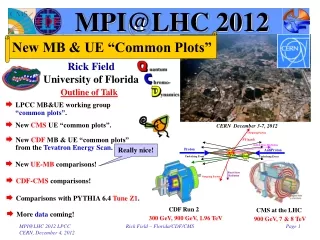
MB&UE Working Group MB & UE Common Plots CMS ATLAS • The LPCC MB&UE Working Group has suggested several MB&UE “Common Plots” the all the LHC groups can produce and compare with each other. Rick Field – Florida/CDF/CMS
“Transverse” Charged Particle Density • Fake data (from MC) at 900 GeV on the “transverse” charged particle density, dN/dhdf, as defined by the leading charged particle (PTmax) and the leading charged particle jet (chgjet#1) for charged particles with pT > 0.5 GeV/c and |h| < 2. The fake data (from PYTHIA Tune DW) are generated at the particle level (i.e. generator level) assuming 0.5 M min-bias events at 900 GeV (361,595 events in the plot). Rick Field MB&UE@CMS Workshop CERN, November 6, 2009 Rick Field – Florida/CDF/CMS
“Transverse” Charged Particle Density • Fake data (from MC) at 900 GeV on the “transverse” charged particle density, dN/dhdf, as defined by the leading charged particle (PTmax) and the leading charged particle jet (chgjet#1) for charged particles with pT > 0.5 GeV/c and |h| < 2. The fake data (from PYTHIA Tune DW) are generated at the particle level (i.e. generator level) assuming 0.5 M min-bias events at 900 GeV (361,595 events in the plot). • CMS preliminary data at 900 GeV on the “transverse” charged particle density, dN/dhdf, as defined by the leading charged particle (PTmax) and the leading charged particle jet (chgjet#1) for charged particles with pT > 0.5 GeV/c and |h| < 2. The data are uncorrected and compared with PYTHIA Tune DW after detector simulation (216,215 events in the plot). Rick Field – Florida/CDF/CMS
“Transverse” Charged PTsum Density • Fake data (from MC) at 900 GeV on the “transverse” charged PTsum density, dPT/dhdf, as defined by the leading charged particle (PTmax) and the leading charged particle jet (chgjet#1) for charged particles with pT > 0.5 GeV/c and |h| < 2. The fake data (from PYTHIA Tune DW) are generated at the particle level (i.e. generator level) assuming 0.5 M min-bias events at 900 GeV (361,595 events in the plot). • CMS preliminary data at 900 GeV on the “transverse” charged PTsum density, dPT/dhdf, as defined by the leading charged particle (PTmax) and the leading charged particle jet (chgjet#1) for charged particles with pT > 0.5 GeV/c and |h| < 2. The data are uncorrected and compared with PYTHIA Tune DW after detector simulation (216,215 events in the plot). Rick Field – Florida/CDF/CMS
PYTHIA Tune DW CMS ATLAS • CMS preliminary data at 900 GeV and 7 TeV on the “transverse” charged particle density, dN/dhdf, as defined by the leading charged particle jet (chgjet#1) for charged particles with pT > 0.5 GeV/c and |h| < 2. The data are uncorrected and compared with PYTHIA Tune DW after detector simulation. • ATLAS preliminary data at 900 GeV and 7 TeV on the “transverse” charged particle density, dN/dhdf, as defined by the leading charged particle (PTmax) for charged particles with pT > 0.5 GeV/c and |h| < 2.5. The data are corrected and compared with PYTHIA Tune DW at the generator level. Rick Field – Florida/CDF/CMS
PYTHIA Tune DW CMS ATLAS • CMS preliminary data at 900 GeV and 7 TeV on the “transverse” charged PTsum density, dPT/dhdf, as defined by the leading charged particle jet (chgjet#1) for charged particles with pT > 0.5 GeV/c and |h| < 2. The data are uncorrected and compared with PYTHIA Tune DW after detector simulation. • ATLAS preliminary data at 900 GeV and 7 TeV on the “transverse” charged PTsum density, dPT/dhdf, as defined by the leading charged particle (PTmax) for charged particles with pT > 0.5 GeV/c and |h| < 2.5. The data are corrected and compared with PYTHIA Tune DW at the generator level. Rick Field – Florida/CDF/CMS
“Transverse” Charge Density Rick Field MB&UE@CMS Workshop CERN, November 6, 2009 factor of 2! 900 GeV → 7 TeV (UE increase ~ factor of 2) LHC 900 GeV LHC 7 TeV ~0.4 → ~0.8 • Shows the charged particle density in the “transverse” region for charged particles (pT > 0.5 GeV/c, |h| < 2) at 900 GeV and 7 TeVas defined by PTmax from PYTHIATune DW andat the particle level (i.e. generator level). Rick Field – Florida/CDF/CMS
PYTHIA Tune DW CMS ATLAS • CMS preliminary data at 900 GeV and 7 TeV on the “transverse” charged particle density, dN/dhdf, as defined by the leading charged particle jet (chgjet#1) for charged particles with pT > 0.5 GeV/c and |h| < 2. The data are uncorrected and compared with PYTHIA Tune DW after detector simulation. • ATLAS preliminary data at 900 GeV and 7 TeV on the “transverse” charged particle density, dN/dhdf, as defined by the leading charged particle (PTmax) for charged particles with pT > 0.5 GeV/c and |h| < 2.5. The data are corrected and compared with PYTHIA Tune DW at the generator level. Rick Field – Florida/CDF/CMS