Download
1 / 40
400 likes | 420 Vues
This study analyzes the inter-dependency between rolling sound performance, safety parameters, and CO2 emission reduction in tires. It examines the effects of performance parameters like rolling sound, rolling resistance, wet grip, and others on aquaplaning, acceleration, dry grip, handling, wet performance, and wear life. The study includes a literature review, test programs, statistical analysis, and conclusions.

E N D
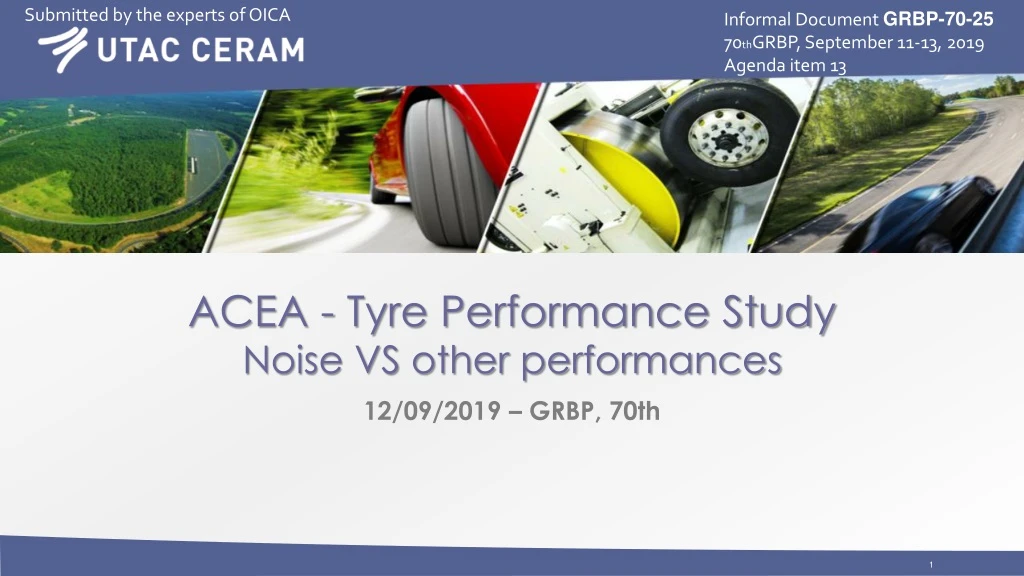
Submitted by the experts of OICA InformalDocumentGRBP-70-25 70thGRBP, September 11-13, 2019 Agenda item 13 ACEA - Tyre Performance StudyNoise VS other performances 12/09/2019 – GRBP, 70th
Content • Literature Study • Test Program • Statistical Analysis • Appendixes ACEA Tyre Performance Study
Reason for why the literature study was conducted • Is it possible to optimize Rolling Sound performance without compromising other parameters essential for vehicle safety and CO2 emission reduction ? • Do performance parameters, i.e. like • Rolling Sound (coast-by) Health Protection • Rolling Resistance Environmental Protection (CO2 emission reduction) • Wet Grip Safety (braking distance, handling) • …affect other performance parameters like • Longitudinal and Lateral Aquaplaning • Rolling Sound during Acceleration • Dry Grip • Dry Handling • Wet Performance • Wear Life ACEA Tyre Performance Study
Significantstudieswhich have been analysed • Journalistic Studies • EVO103_LD (2015) • Auto Express Studies (2018) • Whichcar Wheels (2017) • European Research Organization Studies • GRB-61-03 Study based on TNO 2014 R10735 report (12 June 2014) • FEHRL – Study SI2,408210 Tyre/Road Noise (2007) • Internal Manufacturer Studies • Noise Technology (Continental - 2011) • Noise Trade-offs (Michelin - 2007) • Tire-Road Noise (Goodyear - 2018) • Noise (Michelin – 2015) • Technical UniversityStudies • Inter.noise_HAMBURG 2016 • Tyre modelling for rolling resistance (MASTER’S THESIS IN AUTOMOTIVE ENGINEERING) 2014 ACEA Tyre Performance Study
Analysis template • Framework • Framework and goal of the studies • Content • Description of the content and the parameters of the studies • Vehicle type • Information about vehicles used for each tests • Tyre types, sizes and dimensions • Description of the sample used for each tests • Tracks • Description of the tracks used for each tests • Test methods • Description of the tests methods used • Description of the tests conditions • Description of the tests equipment ACEA Tyre Performance Study
Summary of all important information regarding measured parameters and test method used No study has information in each cell ACEA Tyre Performance Study
Conclusions • 3 Tyre Manufacturers studies show antagonistic relationship between Noise and Safety (Aquaplaning, Wet Grip and Handling) • 2 Tyre Manufacturers studies show relationship between Noise and Rolling Resistance • Test procedures or testing methods are disparate from one study to another • General agreement on the major role of road surface on the noise emission • Due to the purpose of the journalistic studies and the lack of technical information it is difficult to make a statement about the results • The main goal of the journalistic studies is to rank a sample of tyres • Test methods are not described precisely and are different from one study to another • In some studies, repeatability conditions are questionable • Test data are not provided • ACEA Tyre Performance Study aims at determining the inter-dependency between rolling sound, rolling resistance and the main safety performances by carrying out tests according to regulatory or standard procedures ACEA Tyre Performance Study
Test Program • Tests Content • Rolling Resistance • Bench test • RR Index • Rolling Sound • Vehicle test / VW GOLF 5 & NISSAN LEAF • Noise level in different conditions • Wet Grip • Trailer method test on wet surface • Wet Grip index • Dry Grip • Vehicle test / PEUGEOT 308 • Braking performance on dry surface • Dry handling (Flat) Track • Bench test • Cornering stiffness • Aquaplaning • Vehicle test / PEUGEOT 308 • Aquaplaning speed and acceleration under aquaplaning condition • Test sample • 16 different tyre references • OEM x4 • After Market x12 • 2 snow tyres (3PMSF) among the 16 • 205 55 R16 91H, T, V or W • Most common size on European after market ACEA Tyre Performance Study
Test Programs • Test Methods • Rolling Resistance : UN Regulation No.117 procedure • Rolling Sound : UN Regulation No.117 procedure & UN Regulation No.R51.03 • Wet Grip : UN Regulation No.117 procedure • Dry Grip : UN Regulation No.R13H procedure Type 0 • Dry handling (Flat Track): Procedure proposed by ETRTO • Aquaplaning : VDA E08 Longitudinal Aquaplaning & VDA E05 Lateral Aquaplaning ACEA Tyre Performance Study
Tests Schedule 2 sets of tyres to avoid influence on each tests ACEA Tyre Performance Study
Interdependence analysis Results, Explanations & Interpretation ACEA Tyre Performance Study
Results Table *Tyre P is the reference tyre for dry Grip & Longitudinal Aquaplaning. ACEA Tyre Performance Study
Spider Diagrams The 3 best tyres for Noise The 4 best tyres for Safety 10 : Defined by the best tyre of the sample 0 : Defined by the worst tyre of the sample Good in Safety Less in Noise Good in Rolling Sound Less in Aquaplaning ACEA Tyre Performance Study
Spider Diagrams The 3 best tyres for CO2 Less in Handling and Aquaplaning Good in Rolling Resistance ACEA Tyre Performance Study
Toolbox • Principal Component Analysis (PCA) • “Principal component analysis (PCA) is a statistical procedure that uses an orthogonal transformation to convert a set of observations of possibly correlated variables (entities each of which takes on various numerical values) into a set of values of linearly uncorrelated variables called principal components”.Wikipedia • In our case it is used to reduce the number of input characteristics (rolling resistance, dry grip, wet grip and aquaplaning) from 8 to 3 to allow a 2D or 3D visualization 3D representation Letters A to P correspond to the 16 tyres tested ACEA Tyre Performance Study
Toolbox • The P-value or probability value is, for a given statistical model, the probability that, when the null hypothesis is true, the statistical summary would be greater than or equal to the actual observed results. In our case the hypothesis is “there is no correlation between characteristics”. In other words, if p-value is low then our hypothesis is false and we can conclude that there is a correlation. The admitted threshold value is 5%. ACEA Tyre Performance Study
Toolbox • In the chart of scatterplots, Red boxes show strong probability of correlation (P-value <5%) • As the chart is symmetric, we just focus on the right part of it. This tool allows us to show direct relationship between the parameters Without Rolling Sound ACEA Tyre Performance Study
2D charts and Scatterplots for rolling sounds • Comparison between each Rolling Sound tests with P-value <1% • As the P-value is less than 1% we have a top level of probability of correlation We have the opportunity to state on the Rolling Sound performance only through one noise characteristics e. g. R117 dB ACEA Tyre Performance Study
Rolling Sound tests correlation • The tyres are behaving differently depending on the sensitivity of each tyre to the test procedures used (R117, R51C and R51 A). • In general the shape of each “circle” shows a quite good correlation, better for R117 80 vs R51C 80 and R51A 50 vs R51C 50 than for R117 50 vs R51C 50. Difference due to 2 different tests procedure : R51A 50 and R51C 50 Difference due to 2 different tests procedure : R117 50 and R51C 50 Difference due to 2 different tests procedure : R117 80 and R51C 80 This confirmsthatwe can keepjust one representative characteristic among the 5 : R117 80 ACEA Tyre Performance Study
2D charts and Scatterplots dB See next slide for visualization : R117_80 vs Aquaplaning • Same as before but with R117 80 • Red boxes show very strong probability of correlation (P-value <5%) RR Index integer ACEA Tyre Performance Study
Tests results - Visualization • Strong correlation between R117 80 and Aquaplaning visually noticeable (sorted on R117 80) ACEA Tyre Performance Study
Multidimensional Analysis - Axis • Principal Component Analysis (PCA) • Reduce the 8 studied characteristics (Rolling Resistance, Wet Grip, Flat Track 80%, Flat Track 50%, Dry Grip unladen, Dry Grip laden, Longitudinal & Lateral Aquaplaning) to 3 variables 0.88 - • The first 3 axis represent 88 % cumulative inertia • The first 2 68 % 3 1 2 | 3 ACEA Tyre Performance Study
2D representation • In the 2D representation : • The bigger the letters, the more the axis is driven by the tyre in comparison to the others for this 16 tyres sample • The smaller the letters, the less the axis is driven by this tyre in comparison to the others for this 16 tyres sample ACEA Tyre Performance Study
Principal Component Analysis (PCA) • Axis 1 mainly represents Wet Grip, Dry Grip, Lateral aquaplaning To be noted that in axis 1 direction all tests performance improve • It is representative forSafety • Axis 2 mainly represents Flat Track • It is representative for Handling • Axis 3 mainly represents Rolling Resistance and Longitudinal Aquaplaning • It is representative for CO2 Emissions because Rolling Resistance factor is the most important Part of inertia 47% 21% 20% ACEA Tyre Performance Study
PCA Results (1st axis) • R117_80 vs Axis 1 Safety noisier R117 80 quieter Axis 1 mainly controlled by Wet Grip, Dry Grip, Lateral aquaplaning Safer Axis 1 Safety Less safe ACEA Tyre Performance Study
Interpretations (1st axis) • Axis 1 mainly represents Safety through Wet Grip, Dry Grip, Lateral Aquaplaning • The statistic concerning our sample of 16 tyres shows a conflict between Rolling Sound and Safety performances. noisier noisier Focus on Tyre P R117 80 quieter quieter Safer Axis 1 Safety Less safe ACEA Tyre Performance Study
PCA Results (2nd axis) noisier • R117_80 vs Axis 2 Handling R117 80 quieter better worse Axis 2 Handling Axis 2 mainly controlled by Flat Track 50 % and Flat Track 80 % ACEA Tyre Performance Study
Interpretations (2nd axis) • Axis 2 mainly represents handling through Flat Track • Noise and Handling performances improve together along Axis 2 (E does not follow the trend) noisier noisier noisier noisier Focus on Tyre E R117 80 R117 80 quieter quieter quieter quieter worse worse better Axis 2 Handling ACEA Tyre Performance Study
PCA Results (3rd axis) • R117_80 vs Axis 3 CO2 noisier R117 80 quieter worse Axis 3 CO2 better Longitudinal Aquaplaning worse better Axis 3 mainly controlled by Rolling Resistance & Longitudinal Aquaplaning Rolling Resistance ACEA Tyre Performance Study
Interpretations (3rd axis) • Axis 3 mainly represents CO2 Emissions (through Rolling Resistance) and Longitudinal Aquaplaning. • (!) In this axis, performance in Rolling Resistance decreases while increasing in Longitudinal Aquaplaning Focus on Tyre B Focus on Tyre K noisier R117 80 quieter Longitudinal Aquaplaning worse better Axis 3 CO2 Simple conclusion can not be drawn on Axis 3 worse better Rolling Resistance ACEA Tyre Performance Study
Conclusions Measurement Program • This new study offers a comprehensive toolbox to evaluate the relationship between rolling sound and the main other tyre performances according to standard measurement protocols. • A correlation analysis shows that the 5 acoustic characteristics concerning R51.03 (Vehicle measurement) and R117 (Tyre measurement) at different velocities are correlated and can be represented by only one. ACEA Tyre Performance Study
Conclusions Statistical analysis • We have described the relationship between the characteristics through 3 variables with a good level of representativeness (inertia of 88%) • The main table, the spider diagrams and the Principal Components Analysis show a conflict between rolling sound (R117) and Safety performances (Wet Grip, Dry Grip, Lateral Aquaplaning) • Simple conclusions regarding rolling sound, rolling resistance and Safety performance (Longitudinal Aquaplaning) cannot be drawn ACEA Tyre Performance Study
Conclusions Main conclusion • Obtaining a low level of Rolling Sound performance without a compromise regarding other parameters essential for vehicle safety and CO2 emission reduction could not be proven as feasible by this Study ACEA Tyre Performance Study
Conclusions General conclusions • ACEA Tyre Performance Study is the first study to analyze the inter-dependency of the parameters of the tyre with accurate reliable repeatable measurement methods • ACEA Tyre Performance Study conclusions are consistent with the outcomes of the Literature Study regarding Rolling Sound and Vehicle Safety • The ACEA Tyre Performance Study has not observed or deduced any correlation between Rolling Sound and Rolling Resistance as claimed by the FEHRL Study Remark: WLTP has caused a shift in tyre technology in recent years, in order to provide improved Rolling Resistance. The tyres in the study may have been designed before this shift. ACEA Tyre Performance Study
Conclusions Recommendation for complementing the study: • Wear Life testing was part of the initial test program but due to budget constraints the testing could not be performed, although the tyres are available and the test procedure has been defined. • The tyres that could be used also for Wear Life testing can be provided by ACEA and we encourage the stakeholders to raise funding and do the wear test, thus complementing the study in order to deliver a more complete picture of tyre parameters interdependence. ACEA Tyre Performance Study
Conclusions Suggestions • To prove that the conclusions of this study are also valid for other tyre types, the test program needs to be expanded to • Class C1 tyres with bigger outer diameter, tyre width, and lower rolling resistance • Class C1 tyres (winter and reinforced tyres) • Class C2 tyres and Class C3 tyres with bigger outer diameter and tyre width ACEA Tyre Performance Study
THANK YOU FOR YOUR ATTENTION ACEA Tyre Performance Study