
Spectrum Analysis of B2m, CysC, RBP, and TTR with Intensity and m/z Measurements
This study presents detailed mass spectrometry spectra for the proteins B2m, CysC, RBP, and TTR, highlighting their respective peaks and intensity distributions across different m/z values. The data includes the analysis of specific modifications such as des-K58 for B2m, des-S and des-SSP for CysC, and notable cysteinylation and sulfonation in TTR. This comprehensive set of spectra facilitates a deeper understanding of protein modifications and interactions, represented in Figure S1, enhancing the interpretation of mass spectrometry results in protein biochemistry.

Spectrum Analysis of B2m, CysC, RBP, and TTR with Intensity and m/z Measurements
E N D
Presentation Transcript
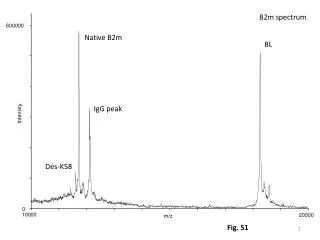
600000 Intensity 0 10000 20000 m/z B2m spectrum Native B2m BL IgG peak Des-K58 Fig. S1
600000 Intensity 0 11000 12400 m/z B2m spectrum Native B2m IgG peak Des-K58 Fig. S1
250000 Intensity 0 13000 19000 m/z CysC spectrum CysC BL Fig. S1
250000 Intensity 0 12600 13800 m/z CysC spectrum 3Pro-OH Native CysC des-S des-SSP Fig. S1
RBP spectrum RBP 140000 BL Intensity 0 16000 23000 m/z Fig. S1
140000 Intensity 0 19000 22000 m/z RBP spectrum Native RBP des-L des-LL Fig. S1
600000 Intensity 0 13000 19000 m/z TTR spectrum TTR BL Fig. S1
600000 Intensity 0 13400 14200 m/z TTR spectrum cysteinylation sulfonation oxidation Native TTR Cys10Gly CysGly Fig. S1