Download
1 / 35
350 likes | 363 Vues
This article explores the development and progress in digital TOFPET for PET imaging chain and UC PET R&D cyclotron, including clinical outcomes and biological discoveries in cancer, cardiac, brain, and drug-related imaging. It also focuses on the integration with medicine and biology, image reconstruction techniques, and quantitative image analysis.

E N D
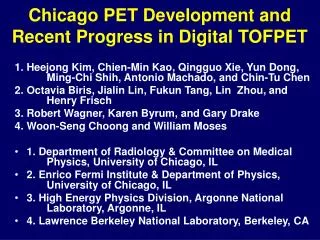
Chicago PET Development and Recent Progress in Digital TOFPET 1.Heejong Kim, Chien-Min Kao, Qingguo Xie, Yun Dong, Ming-Chi Shih, Antonio Machado, and Chin-Tu Chen 2. Octavia Biris, Jialin Lin, Fukun Tang, Lin Zhou, and Henry Frisch 3. Robert Wagner, Karen Byrum, and Gary Drake 4. Woon-Seng Choong and William Moses • 1. Department of Radiology & Committee on Medical Physics,University of Chicago, IL • 2. Enrico Fermi Institute & Department of Physics, University of Chicago, IL • 3. High Energy Physics Division, Argonne National Laboratory, Argonne, IL • 4. Lawrence Berkeley National Laboratory, Berkeley, CA
PET Imaging Chain and UC PET R&D Cyclotron/ Radiotracer [Multi-Modality Probes] Detector & System [Panel-PET & SiPM] Clinical Outcomes & Biological Discoveries [Cancer, Cardiac, Brain, Drug, etc.] Subject (Human/Animal) Electronics [Digital PET] Performance Evaluation [Task-Based Assessment] Integration with Medicine & Biology Image Reconstruction [MM-IR & ROI-IR] Quantitative Image Analysis [MM QIA & List-Mode Dynamic 4D/5D QIA]
Quantitative ImagingMulti-Modality IntegrationHigh-PerformanceLow-CostBroad-Access
PET Imaging Chain and UC PET R&D Cyclotron/ Radiotracer [Multi-Modality Probes] Detector & System [Panel-PET & SiPM] Clinical Outcomes & Biological Discoveries [Cancer, Cardiac, Brain, Drug, etc.] Subject (Human/Animal) Electronics [Digital PET] Performance Evaluation[Task-Based Assessment] Integration with Medicine & Biology Image Reconstruction [MM-IR & ROI-IR] Quantitative Image Analysis [MM QIA & List-Mode Dynamic 4D/5D QIA]
Imaging of Life and Life Processes Live Brain Dead Brain
Task-Based Image Quality AssessmentTasks – Detection and Estimation
2008 IEEE NSS/MIC/RTSDMIC Short Course " Image Quality in Adaptive and Multimodality Imaging"20 October 2008Dresden, Germany Organizer: Harrison Barrett, Matthew A. Kupinski, Lars R. Furenlid
PET Imaging Chain and UC PET R&D Cyclotron/ Radiotracer[Multi-Modality Probes] Detector & System [Panel-PET & SiPM] Clinical Outcomes & Biological Discoveries [Cancer, Cardiac, Brain, Drug, etc.] Subject (Human/Animal) Electronics [Digital PET] Performance Evaluation [Task-Based Assessment] Integration with Medicine & Biology Image Reconstruction [MM-IR & ROI-IR] Quantitative Image Analysis [MM QIA & List-Mode Dynamic 4D/5D QIA]
Key Characteristics of Biomarker Generator Micro Accelerator • Lower cost & much smaller to be located at scanner • To be an approved FDA medical device • Produce dose of F-18 or C-11 biomarker in 20 minutes • Base chemistry system for drug discovery • Handling of micro to millicuries, not curies Biomarker Generator ABT Microchemistry & Microfluidics Courtesy of Nanotek & ABT
Multi-Modality Targeting Molecular Imaging & Therapeutic Probes (Phage and Micelle Nanosystem) Ultrasound, MRI, SPECT, PET, X-Ray/CT,Fluorescence & Therapeutics
PET Imaging Chain and UC PET R&D Cyclotron/ Radiotracer [Multi-Modality Probes] Detector & System [Panel-PET & SiPM] Clinical Outcomes & Biological Discoveries [Cancer, Cardiac, Brain, Drug, etc.] Subject (Human/Animal) Electronics [Digital PET] Performance Evaluation [Task-Based Assessment] Integration with Medicine & Biology Image Reconstruction [MM-IR & ROI-IR] Quantitative Image Analysis[MM QIA & List-Mode Dynamic 4D/5D QIA]
Image Co-Registration & Integration Fusion of PET, SPECT, MRI, CT, EPRI, Histology Halpern, Pelizzari Karczmar Weichselbaum
PET Imaging Chain and UC PET R&D Cyclotron/ Radiotracer [Multi-Modality Probes] Detector & System [Panel-PET & SiPM] Clinical Outcomes & Biological Discoveries [Cancer, Cardiac, Brain, Drug, etc.] Subject (Human/Animal) Electronics [Digital PET] Performance Evaluation [Task-Based Assessment] Integration with Medicine & Biology Image Reconstruction[MM-IR & ROI-IR] Quantitative Image Analysis [MM QIA & List-Mode Dynamic 4D/5D QIA]
600 ps 2 ns
PET Imaging Chain and UC PET R&D Cyclotron/ Radiotracer [Multi-Modality Probes] Detector & System[Panel-PET & SiPM] Clinical Outcomes & Biological Discoveries [Cancer, Cardiac, Brain, Drug, etc.] Subject (Human/Animal) Electronics [Digital PET] Performance Evaluation [Task-Based Assessment] Integration with Medicine & Biology Image Reconstruction [MM-IR & ROI-IR] Quantitative Image Analysis [MM QIA & List-Mode Dynamic 4D/5D QIA]
Silicon PM Characterization Source: F-18 Front MPPC: 1x1mm2 25-mm, 50-mm, or 100-mm Back LYSO: 1x1x10mm3, 2x2x10mm3
F-18/LYSO Sample Pulses 25-mm MPPC PMT 100-mm MPPC 50-mm MPPC
A Table-Top Prototype The prototype consists of two HRRT (High Resolution Research Tomograph) detector heads. The spacing between detectors shown is ~6 cm, which is adequate for imaging rodents. HRRT Detector Heads A single double-layered, 8 x 8 LSO crystal block affixes onto 4 photomultiplier tubes in the quadrant-sharing configuration. CNMF, September 26, 2008
Central Sensitivity(GATE Simulation, 20% ER, 3ns TR) Sensitivity (%) LLD (keV)
Noise-Equivalent Count RateComparison with reported NECR peaks Rat Mouse Mouse Reported NECR peaks Reported NECR peaks
FDG Resolution phantomreal data 0.75mm 1.0 mm 2.4 mm 1.35mm 1.7 mm 2.0 mm Modeling the responses by MC simulation Ideal line integral
Sample Imagereal FDG-Rat data Modeling response Ideal line integral 22
Initial FDG-Rat Images Transaxial Coronal Sagittal
PET Imaging Chain and UC PET R&D Cyclotron/ Radiotracer [Multi-Modality Probes] Detector & System [Panel-PET & SiPM] Clinical Outcomes & Biological Discoveries [Cancer, Cardiac, Brain, Drug, etc.] Subject (Human/Animal) Electronics[Digital PET] Performance Evaluation [Task-Based Assessment] Integration with Medicine & Biology Image Reconstruction [MM-IR & ROI-IR] Quantitative Image Analysis [MM QIA & List-Mode Dynamic 4D/5D QIA]
Digital PET Data AcquisitionA Multi-Threshold Approach discriminators PMT IN TDC V1 TDC V2 TDC V3 TDC V4
Multi-Threshold Approach • Sampling pulse at pre-defined voltage • levels. • Output : only digitized timings. • Pulse reconstruction using digitized timings. • Remove analog blocks. • (Pre-Amp, ADC, CFD) • Digital Signal Processing(DSP) technology • can be utilized. • (event time, energy) PMT waveform by 20GS/s oscilloscope superimposed with timing readouts by the multi-threshold board + HPTDC
Multi-Threshold Board + HPTDC • Multi-threshold discriminator board • 2 boards with 4channels in each. • 0-700mV of adjustable threshold level. • Used ADCMP582 comparators. • Timings at leading and falling edges. HPTDC (CERN) 4 chs output Threshold Set Input High Performance TDC (HPTDC) 8/32 channels. 25 ps/bit. developed at CERN. Multi-threshold board (left) connected to HPTDC module (right).
Experimental Setup • Two Hamamatsu R9800 photomultiplier tubes • (HV = -1,300V) • Coupled with LSO crystals • ( 6.25x6.25x25mm3). • Separated 5cm apart. • Na-22 used for positron source located • at the center. • Multi-threshold discriminator board setup: • Inputs from 2 PMT signals • Thresholds : 50, 100, 200, 300mV • Timing Readout : • TDS6154 oscilloscope20GS/s. • (Tektronix) • HPTDC. • ( 8chs, 25 ps/bit, developed at CERN) A Block diagram of the setup.
Time Resolution of Discriminator • Sent pulse generator signals to two • channels. • Measured time difference with the • TDS6154 oscilloscope. • Time resolution of single channel : • ~13.3ps(FWHM) Time offset between two channels of the Multi-threshold discriminator.
Pulse Reconstruction (HPTDC) • Select the gamma coincidence events. • events with 2, 3 and 4 hits from each • board. • Reconstructed pulse shape. • Linear fit on the leading edge. • (event time). • Exponential fit on the falling edge. • (energy, decay constant) Energy distribution of 511keV gamma.
Pulse Recontstruction - 2 The decay time constant.
Coincidence Timing Resolution • Select the coincidence events. • Least square fit to the leading edge • timings. • Use two leading edges • with100, 200mV thresholds. • Extrapolated at 0mV. • The time difference, t1-t2. (FWHM) • Oscilloscope : 330ps • HPTDC : 350ps Time difference of 511keV gamma coincidence events
PET Imaging Chain and UC PET R&D Cyclotron/ Radiotracer [Multi-Modality Probes] Detector & System [Panel-PET & SiPM] Clinical Outcomes & Biological Discoveries [Cancer, Cardiac, Brain, Drug, etc.] Subject (Human/Animal) Electronics [Digital PET] Performance Evaluation [Task-Based Assessment] Integration with Medicine & Biology Image Reconstruction [MM-IR & ROI-IR] Quantitative Image Analysis [MM QIA & List-Mode Dynamic 4D/5D QIA]