16
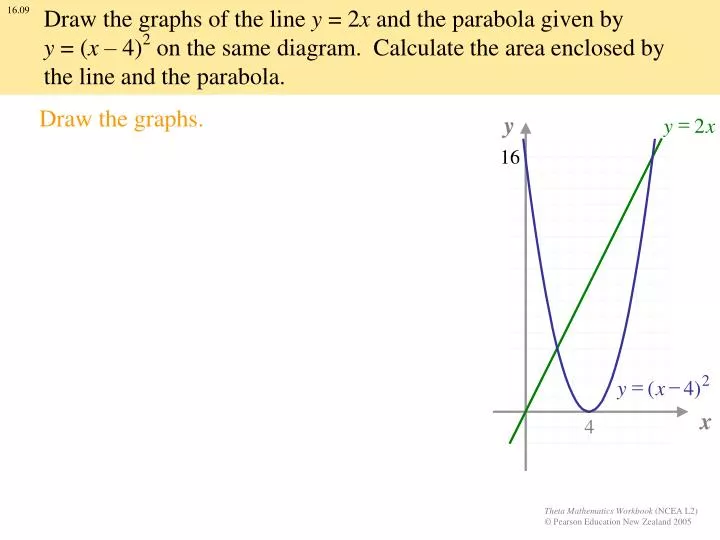
16.09. Draw the graphs of the line y = 2 x and the parabola given by y = ( x – 4) 2 on the same diagram. Calculate the area enclosed by the line and the parabola. y. 16. =. y. 2. x. 2. =. -. y. (. x. 4. ). x. 4. Draw the graphs. 16.09.

16
E N D
Presentation Transcript
16.09 Draw the graphs of the line y = 2x and the parabola given by y = (x– 4)2 on the same diagram. Calculate the area enclosed by the line and the parabola. y 16 = y 2 x 2 = - y ( x 4 ) x 4 Draw the graphs.
16.09 Draw the graphs of the line y = 2x and the parabola given by y = (x– 4)2 on the same diagram. Calculate the area enclosed by the line and the parabola. y 16 x 4 To find the area between the line and the parabola, we first need to find the x-values of the points of intersection. Solve the equations y = 2x and y = (x– 4)2 simultaneously.
16.09 Draw the graphs of the line y = 2x and the parabola given by y = (x– 4)2 on the same diagram. Calculate the area enclosed by the line and the parabola. y 16 x 4 2 8 To find the area between the line and the parabola, we first need to find the x-values of the points of intersection.
16.09 Draw the graphs of the line y = 2x and the parabola given by y = (x– 4)2 on the same diagram. Calculate the area enclosed by the line and the parabola. The combination of bothis the area under the line. The area shadedis the area under the parabola. The required area is shaded y Look at the areas shaded on the graph. 16 Thus the required area is the difference between the area under the line between x = 2 and x = 8 and the area under the parabola. x 2 4 8
16.09 Draw the graphs of the line y = 2x and the parabola given by y = (x– 4)2 on the same diagram. Calculate the area enclosed by the line and the parabola. Under line Under parabola y 16 x 2 4 8