Download
1 / 61
610 likes | 846 Vues
Evolutionary Genetics II. Making Species - Reproductive Isolation A. Pre-Zygotic Barriers B. Post-Zygotic Isolation. Evolutionary Genetics II. Making Species - Reproductive Isolation A. Pre-Zygotic Barriers B. Post-Zygotic Isolation 1. Genomic Incompatibility - zygote dies.

E N D
Evolutionary Genetics II. Making Species - Reproductive Isolation A. Pre-Zygotic Barriers B. Post-Zygotic Isolation
Evolutionary Genetics II. Making Species - Reproductive Isolation A. Pre-Zygotic Barriers B. Post-Zygotic Isolation 1. Genomic Incompatibility - zygote dies
Evolutionary Genetics II. Making Species - Reproductive Isolation A. Pre-Zygotic Barriers B. Post-Zygotic Isolation 1. Genomic Incompatibility - zygote dies 2. Hybrid Inviability - F1 has lower survival Crazy hybrids A ‘zedonk’
Evolutionary Genetics II. Making Species - Reproductive Isolation A. Pre-Zygotic Barriers B. Post-Zygotic Isolation 1. Genomic Incompatibility - zygote dies 2. Hybrid Inviability - F1 has lower survival 3. Hybrid Sterility - F1 has reduced reproductive success Horse: 64 chromosomes Donkey: 62 chromosomes Mule: 63 non-homologous chromosomes
Evolutionary Genetics II. Making Species - Reproductive Isolation A. Pre-Zygotic Barriers B. Post-Zygotic Isolation 1. Genomic Incompatibility - zygote dies 2. Hybrid Inviability - F1 has lower survival 3. Hybrid Sterility - F1 has reduced reproductive success 4. F2 breakdown - F1's survive but F2's have incompatible combo's of genes
AABB x aabb F1: AaBb = ok F2: A-B- = ok A-bb = no aaB- = no aabb = ok
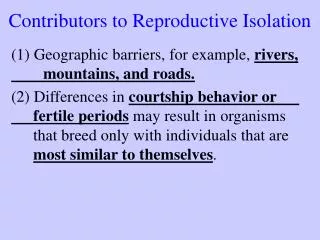
Evolutionary Genetics II. Making Species - Reproductive Isolation A. Pre-Zygotic Barriers 1. Geographic Isolation (large scale or habitat) 2. Temporal Isolation 3. Behavior Isolation - don't recognize one another as mates 4. Mechanical isolation - genitalia don't fit; limit pollinators 5. Gametic Isolation - gametes transferred but sperm can't fertilize egg; this is a common isolation mechanism in species that spawn at the same time B. Post-Zygotic Isolation 1. Genomic Incompatibility - zygote dies 2. Hybrid Inviability - F1 has lower survival 3. Hybrid Sterility - F1 has reduced reproductive success 4. F2 breakdown - F1's survive but F2's have incompatible combo's of genes All of these – except geographic isolation - are fundamentally genetic in nature because physiology (gametic), morphology (mechanical), and behavior (temporal and behavioral) have a genetic component. Obviously, the post-zygotic barriers are entirely genetic. Speciation is the process of creating a genetically distinct population, which maintains its distinction in the face of possible hybridization.
Evolutionary Genetics II. Making Species - Reproductive Isolation III. Rates of Evolution and Speciation A. Evolution and Speciation - Evolution and speciation are not the same: Evolution is a change in the genetic structure of a population Speciation is the establishment of reproductive isolation between populations. - Two populations can evolve over time, but maintain gene flow and not speciate. - Two populations can become geographically isolated and be ‘good species’, while being genetically similar. - Small genetic differences can create genomic incompatibility, change in genitalia, or behavioral differences that cause speciation. So, while increasing genetic divergence increases the probability of speciation, small changes can cause reproductive isolation, too.
Evolutionary Genetics II. Making Species - Reproductive Isolation III. Rates of Evolution and Speciation A. Evolution and Speciation B. Rates of Evolution - depends on: - rate of mutation, introducing new variation (AIDS virus – error-prone reverse transcriptases introduce many mutations each generation, changing the surface proteins and making it very hard for our immune systems to eliminate all of them.)
Evolutionary Genetics II. Making Species - Reproductive Isolation III. Rates of Evolution and Speciation A. Evolution and Speciation B. Rates of Evolution - depends on: - rate of mutation, introducing new variation - size of the population (freq of new allele = 1/2N; so a mutation in a small population will be at a higher frequency that it would be in a large population)
Evolutionary Genetics II. Making Species - Reproductive Isolation III. Rates of Evolution and Speciation A. Evolution and Speciation B. Rates of Evolution - depends on: - rate of mutation, introducing new variation - size of the population - effect of this variation (deleterious and adaptive mutations will change frequency rapidly in response to selection; neutral variation will change by drift, alone.)
Evolutionary Genetics II. Making Species - Reproductive Isolation III. Rates of Evolution and Speciation A. Evolution and Speciation B. Rates of Evolution - depends on: - rate of mutation, introducing new variation - size of the population - effect of this variation - rate of reproduction of the population Populations with high reproductive rates should change faster that populations with low reproduction rates.
Evolutionary Genetics II. Making Species - Reproductive Isolation III. Rates of Evolution and Speciation A. Evolution and Speciation B. Rates of Evolution - depends on: - patterns: As a result of the sequencing boom that began in the 1960’s, biologists realized that there was an extraordinary amount of genetic variation in most populations – variation at the molecular level in DNA sequence. - On average, About 20-30% of all loci are polymorphic (have at least 2 alleles with frequencies over 1%). - D. melanogaster has 10,000 loci, so 3000 are polymorphic. - At these polymorphic loci, Heterozygosity = 0.33
Variation in the alcohol dehydrogenase gene, fixed in different populations of Drosophila melanogaster This is the only variation that changes an amino acid; all others are ‘silent’
The frequency of different disease-causing mutations in the CFTR gene. Each different mutation is a different allele; most of them are very rare (<1.0%), and all of them are deleterious so selection keeps them rare.
Evolutionary Genetics II. Making Species - Reproductive Isolation III. Rates of Evolution and Speciation A. Evolution and Speciation B. Rates of Evolution - depends on: - patterns: As a result of the sequencing boom that began in the 1960’s, biologists realized that there was an extraordinary amount of genetic variation in most populations – variation at the molecular level in DNA sequence. - On average, About 20-30% of all loci are polymorphic (have at least 2 alleles with frequencies over 1%). - D. melanogaster has 10,000 loci, so 3000 are polymorphic. - At these polymorphic loci, Heterozygosity = 0.33 Selection can’t maintain all this heterozygosity (like with sickle cell); we would each be homozygous for at least one deleterious recessive and have reduced fitness. Something ELSE must be maintaining this variation….. Motoo Kimura suggested that most variation was neutral, maintained by drift.
Evolutionary Genetics II. Making Species - Reproductive Isolation III. Rates of Evolution and Speciation A. Evolution and Speciation B. Rates of Evolution - depends on: - patterns: - Predictions of the Neutral Model: Rates of substitution should be higher in non-functional (neutral) regions of proteins, in introns, and in the third position of codons, because changes here are neutral. - CONFIRMED
Evolutionary Genetics II. Making Species - Reproductive Isolation III. Rates of Evolution and Speciation A. Evolution and Speciation B. Rates of Evolution - depends on: - patterns: - Predictions of the Neutral Model: Rates of substitution should be higher in non-functional (neutral) regions of proteins, in introns, and in the third position of codons, because changes here are neutral. – CONFIRMED The rate of molecular evolution (substitutions) should be independent of the rate of morphological change; a species that changes slowly morphologically can still be changing as rapidly, genetically, as a species that changes fast morphologically. - CONFIRMED
Evolutionary Genetics II. Making Species - Reproductive Isolation III. Rates of Evolution and Speciation A. Evolution and Speciation B. Rates of Evolution - depends on: - patterns: - Predictions of the Neutral Model: Rates of substitution should be higher in non-functional (neutral) regions of proteins, in introns, and in the third position of codons, because changes here are neutral. – CONFIRMED The rate of molecular evolution (substitutions) should be independent of the rate of morphological change; a species that changes slowly morphologically can still be changing as rapidly, genetically, as a species that changes fast morphologically. – CONFIRMED The rate of substitution of one allele in a population by another allele should occur at a constant rate – a molecular ‘clock’ - CONFIRMED.
Evolutionary Genetics II. Making Species - Reproductive Isolation III. Rates of Evolution and Speciation A. Evolution and Speciation B. Rates of Evolution - depends on: - patterns: - Predictions of the Neutral Model: - Problem: In the neutral model, mutations should accumulate at a constant rate…but constant in relative time – relative to the generation time of the organism. Species with short generation times should accumulate changes more rapidly than species that have longer generation times. This is true for non-coding DNA, as expected for neutral DNA. But it is NOT true for proteins and protein coding sequences, where AA substitution rates are constant in absolutely time across species – suggesting that some selection is acting. Ohta’s “nearly neutral” model
The Nearly Neutral Model (Ohta) - We observe a constant AA substitution rate across species, even though we would expect that species with shorter generation times should have FASTER rates of substitution. OBS. Sub. Rate EXP. Short GEN TIME Long
The Nearly Neutral Model (Ohta) SO. - We observe a constant AA substitution rate across species, even though we would expect that species with shorter generation times should have FASTER rates of substitution. - So, something must be 'slowing down' this rate of substitution in species with short gen. times. What's slowing it down is their large populations size, such that the effects of drift, alone, are reduced. LARGE POP. SIZE OBS. Sub. Rate EXP. Short GEN TIME Long
The Nearly Neutral Model (Ohta) SO. - We observe a constant AA substitution rate across species, even though we would expect that species with shorter generation times should have FASTER rates of substitution. - So, something must be 'slowing down' this rate of substitution in species with short gen. times. What's slowing it down is their large populations size, such that the effects of drift, alone, are reduced. - Likewise, species with long generation times have small populations, and substitution by drift and fixation is more rapid than expected based on generation time, alone. SMALL POP. SIZE OBS. Sub. Rate EXP. Short GEN TIME Long
The Nearly Neutral Model (Ohta) SO. - We observe a constant AA substitution rate across species, even though we would expect that species with shorter generation times should have FASTER rates of substitution. - So, something must be 'slowing down' this rate of substitution in species with short gen. times. What's slowing it down is their large populations size, such that the effects of drift, alone, are reduced. - Likewise, species with long generation times have small populations, and substitution by drift and fixation is more rapid than expected based on generation time, alone. SMALL POP. SIZE SO. - The constant rate of AA substitution across species is due to the balance between generation time and population size. OBS. Sub. Rate EXP. Short GEN TIME Long
Evolutionary Genetics II. Making Species - Reproductive Isolation III. Rates of Evolution and Speciation A. Evolution and Speciation B. Rates of Evolution C. Using Molecular Clocks - the more differences there are, the more time must have elapsed since a common ancestor for these differences to accumulate. - If we know the rate of change for a given set of genes or proteins, then we can estimate the absolute time since divergence.
Sequences of cytochrome c from NCBI >Arabidopsis MASFDEAPPGNPKAGEKIFRTKCAQCHTVEKGAGHKQGPNLNGLFGRQSGTTPGYSYSAA NKSMAVNWEEKTLYDYLLNPKKYIPGTKMVFPGLKKPQDRADLIAYLKEGTA >Euglena GDAERGKKLFESRAGQCHSSQKGVNSTGPALYGVYGRTSGTVPGYAYSNANKNAAIVWED ESLNKFLENPKKYVPGTKMAFAGIKAKKDRLDIIAYMKTLKD >Hippo GDVEKGKKIFVQKCAQCHTVEKGGKHKTGPNLHGLFGRKTGQSPGFSYTDANKNKGITWG EETLMEYLENPKKYIPGTKMIFAGIKKKGERADLIAYLKQATNE >Mosquito MGVPAGDVEKGKKLFVQRCAQCHTVEAGGKHKVGPNLHGLFGRKTGQAAGFSYTDANKAK GITWNEDTLFEYLENPKKYIPGTKMVFAGLKKPQERGDLIAYLKSATK >Rice MASFSEAPPGNPKAGEKIFKTKCAQCHTVDKGAGHKQGPNLNGLFGRQSGTTPGYSYSTA NKNMAVIWEENTLYDYLLNPKKYIPGTKMVFPGLKKPQERADLISYLKEATS
Euglena Mosquito Hippo Rice Arabidopsis
Unresolved molecular phylogenies of gibbons and siamangs (Family: Hylobatidae) based on mitochondrial, Y-linked, and X-linked loci indicate a rapid Miocene radiation or sudden vicariance eventMolecular Phylogenetics and Evolution, Volume 58, Issue 3, March 2011, Pages 447-455H. Israfil, S.M. Zehr, A.R. Mootnick, M. Ruvolo, M.E. Steiper
Evolutionary Genetics II. Making Species - Reproductive Isolation III. Rates of Evolution and Speciation A. Evolution and Speciation B. Rates of Evolution C. Using Molecular Clocks D. Concordant Phylogenies
D. Concordant Phylogenies IF species are descended from common ancestors (like people in a family), and IF we know the rate of genetic change (mutation), THEN we should be able to compare genetic similarity and predict when common ancestors lived. AND, if the fossil record is also a product of evolution, THEN the species though to be ancestral to modern groups should exist at this predicted age, too. In other words, we should be able to compare DNA and protein sequences in living species and predict where, in the sedimentary strata of the Earth’s crust, a third different species should be.
D. Concordant Phylogenies Clustering analysis based on amino acid similarity across seven proteins from 17 mammalian species.
D. Concordant Phylogenies Now, we date the oldest mammalian fossil, which our evolution hypothesis dictates should be ancestral to all mammals, both the placentals (species 1-16) and the marsupial kangaroo. …. This dates to 120 million years 16
D. Concordant Phylogenies And, through our protein analysis, we already know how many genetic differences (nitrogenous base substitutions) would be required to account for the differences we see in these proteins - 98. 16
D. Concordant Phylogenies So now we can plot genetic change against time, hypothesizing that this link between placentals and marsupials is ancestral to the other placental mammals our analysis. 16
D. Concordant Phylogenies Now we can test a prediction. IF genetic similarity arises from descent from common ancestors, THEN we can use genetic similarity to predict when common ancestors should have lived... 16
D. Concordant Phylogenies This line represents that prediction. Organisms with more similar protein sequences (requiring fewer changes in DNA to explain these protein differences) should have more recent ancestors... 16
And the prediction here becomes even MORE precise. For example, we can predict that two species, requiring 50 substitutions to explain the differences in their proteins, are predicted to have a common ancestor that lived 58-60 million years ago... D. Concordant Phylogenies 16
D. Concordant Phylogenies Let’s test that prediction. Rabbits and the rodent differ in protein sequence to a degree requiring a minimum of 50 nucleotide substitutions... Where is the common ancestor in the fossil record?
D. Concordant Phylogenies Just where genetic analysis of two different EXISTING species predicts. 16
D. Concordant Phylogenies OK, but what about all of our 16 "nodes"? Evolution predicts that they should also exist on or near this line.... 16
D. Concordant Phylogenies And they are. Certainly to a degree that supports our hypothesis based on evolution. Concordance between molecular clocks and the geologic record
Evolutionary Genetics II. Making Species - Reproductive Isolation III. Rates of Evolution and Speciation A. Evolution and Speciation B. Rates of Evolution C. Using Molecular Clocks D. Concordant Phylogenies E. Rates of Speciation - Speciation can be an instantaneous genetic event – through polyploidy, or mutation that affects specific genes important in forming a reproductive isolating barrier.
Evolutionary Genetics II. Making Species - Reproductive Isolation III. Rates of Evolution and Speciation A. Evolution and Speciation B. Rates of Evolution C. Using Molecular Clocks D. Concordant Phylogenies E. Rates of Speciation - Speciation can be an instantaneous genetic event – through polyploidy, or mutation that affects specific genes important in forming a reproductive isolating barrier. - But speciation can also be a continuous process, reflecting the accumulation of genetic differences. Still, these differences might accumulate at a steady rate or at episodic rates.
- But speciation can also be a continuous process, reflecting the accumulation of genetic differences. Still, these differences might accumulate at a steady rate or at episodic rates.
- 1972 - Eldridge and Gould - Punctuated Equilibrium 1. Consider a large, well-adapted population VARIATION TIME
- 1972 - Eldridge and Gould - Punctuated Equilibrium 1. Consider a large, well-adapted population Effects of Selection and Drift are small - little change over time VARIATION TIME
- 1972 - Eldridge and Gould - Punctuated Equilibrium 2. There are always small sub-populations "budding off" along the periphery of a species range... VARIATION TIME
- 1972 - Eldridge and Gould - Punctuated Equilibrium 2. Most will go extinct, but some may survive... X VARIATION X X TIME