Download
1 / 33
330 likes | 344 Vues
This system enables ecological forecasting by integrating surface, satellite, and climate data with ecosystem models. It provides short-term, mid-term, and long-term forecasts for irrigation, water resources, fire risk, phenology, and more.

E N D
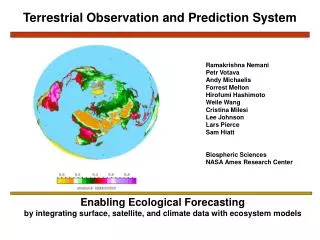
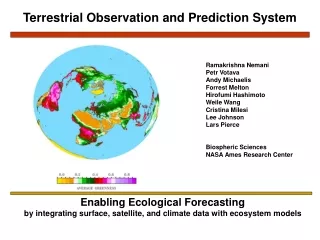
Terrestrial Observation and Prediction System Enabling Ecological Forecastingby integrating surface, satellite, and climate data with ecosystem models Ramakrishna Nemani Petr Votava Andy Michaelis Forrest Melton Hirofumi Hashimoto Weile Wang Cristina Milesi Lee Johnson Lars Pierce Biospheric Sciences NASA Ames Research Center
Ecological Forecasting • Ecological Forecasting (EF) predicts the effects of changes in the physical, chemical, and biological environments on ecosystem state and activity.
Short-term Monitoring and Forecasting Irrigation requirements Sacramento river flooding, California Based on weather forecasts, conditioned on historical ecosystem state hours to days
Mid-term/Seasonal Forecasts of water resources, fire risk, phenology ENSO-Rainfall over U.S El Nino La Nina Based on ENSO forecasts Weeks to months
Long-term Projected changes Based on GCM outputs Decades to centuries
Fluxnet Weather network Access to a variety of observing networks Soil moisture network Streamflow network
Access to a variety of remote sensing platforms Integration across Platforms, Sensors, Products, DAACs ..Non-trivial
Ability to integrate a variety of models Biogeochemical Cycling Crop growth/yield Pest/Disease Global carbon cycle Prognostic/diagnostic models
Ability to work across different time and space scales Hours Years/Decades Days Weeks/Months Weather/Climate Forecasts at various lead times downscaling
TOPS-Gateway Customized for our partners
Mapping changes in global net primary production near real-time depiction of the droughts in the Amazon and Horn of Africa, May 2005 Near realtime monitoring of global NPP anomalies Running et al., 2004, Bioscience, 54:547-560
Developing Data-driven Models from TOPS Flux Towers + Satellite data Flux-GPP vs SVM-GPP Flux Towers Input data layers Annual GPP from SVM model + Maximum LUE Inverted from annual GPP Support Vector Machine εmax(gC/MJ) 0.0 1.0 2.0 [Yang et al., 2006]
Lawns form the largest irrigated surface in the U.S Problem statement Lawns are ubiquitous among urban landscapes in the U.S., and use large quantities of dwindling summer water supplies, pesticides and fertilizers. There have not been national observation-based estimates of the surface under lawn. Data Landsat-Thematic Mapper, Night lights from DMSP, and aerial photography Key results Area under irrigated grass exceeds that of irrigated corn, making it the single largest irrigated surface in the U.S. Large savings in urban water use can be accomplished by improved irrigation scheduling. Reference Milesi, C., C. Elvidge, R.R. Nemani and S.W. Running. 2005. Mapping and modeling the biogeochemical cycling of turf grasses in the United States, Environmental Management, 36 (3): 426-438.
TOPS over California since 2000 Large geographic area, 265,000 km2 Population over 35M Semi-arid climate Irrigated orchards/crops Urban/rural water conflicts Energy shortage Weather networks often operated by different govt. agencies and/or private industry. Rarely integrated because they are intended for different audiences. We specialize in bringing them together to provide spatially continuous data.
Daily Weather Surfaces 1KM TMAX TMIN Humidity Rainfall Sunshine Raw data Gridded Products
Using TOPS Data to Identify Drivers of Mosquito Abundance and Virus Transmission Risk in California and western U.S. Correlations between temperatures and mosquito abundance in CA These relationships are being used to develop predictive models.
Forecasting Stream Temperature for Anadromous Fisheries Management TOPS data and regional climate models will drive forecasts of steam temperature developed by NOAA Fisheries. Forecasts will be used in decision making related to water releases for management of habitat for endangered fish species.
Wildfire Monitoring Rapid Prototyping Concept MODIS/TOPS/RAMS
Wind TOPS/RAMS Simulations in support of small fires 20x20km around the fire Rapid delivery (<30mts) Ability to update Rh
Irrigation Forecasts Irrigation Forecast for week of July 19-26, 2005 Tokalon Vineyard, Oakville, CA CIMIS Measured Weather Data through July 18, 2005 NWS Forecast Weather Data July 19-26, 2005 0 30 Forecast Irrigation (mm) 0 meters 1000 N Fully automated web delivery to growers
Adapting TOPS for NPS needs • Understand the past • Manage the present • Prepare for the future National Park Service
Ecosystem changes over continental scales understand the past Changes in peak NDVI
Interannual variability in NDVI over Yosemite National Park understand the past Yosemite National Park
Watershed scale analysis of the anomalous 2004 using MODIS 250 data understand the past Yosemite National Park
Monitoring stream flow monitor the present Yosemite National Park
Vegetation monitoring using MODIS FPAR Yosemite National Park monitor the present
Snow monitoring using MODIS Yosemite National Park monitor the present
Impact of projected warming on Yosemite snow dynamics prepare for the future Yosemite National Park
Growing season dynamics under climate change Yosemite National Park prepare for the future
Projected trends in vegetation productivity prepare for the future Yosemite National Park
Summary Potential exists for providing ecological forecasts of various lead times Characterizing and communicating uncertainty remains a key issue We need: Improved in-situ monitoring networks. Rapid access to satellite data. Better linkages among models. Comprehensive framework for data management Improved delivery systems to decision makers