Download
1 / 33
340 likes | 437 Vues
Learn about the method, advantages, and proposed identification methods of Relay-Feedback Tests for dynamic information crucial for feedback controller design. Discover ways to maximize information through curve shapes and proposed procedures for improved effectiveness.

E N D
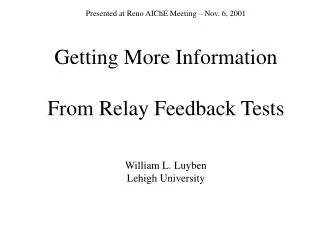
Presented at Reno AIChE Meeting – Nov. 6, 2001 Getting More Information From Relay Feedback Tests William L. Luyben Lehigh University
Scope • Relay-Feedback Test – method, advantages, • normal results = Ku and Pu • Curve Shapes – change with deadtime • Proposed Curvature Factor • Proposed Identification Method D, Kp and • Effectiveness • Conclusion
Relay-Feedback Test • Insert relay in feedback loop, specify height “h” • (high gain P controller, Hi and Lo limits on OP • OPhi – OPlo = 2 h) • Produces limit cycle in PV signal • with period = ultimate gain = Pu • and amplitude “a” PVmax – PVmin = 2 a • Calculate ultimate gain = Ku = 4h/a
Pu=3.5 a=0.17 0.2 0.1 PV 0 -0.1 -0.2 0 5 10 15 Time (minutes) h=1 1 0.5 OP 0 -0.5 -1 0 5 10 15 Time (minutes)
Advantages • Fast • Only need to specify “h” • Gives accurate dynamic information at frequency • that is important for feedback controller design. • Closedloop test. Keeps process in linear region. • Detect load changes from asymmetric pulses. • Limitation - only get two parameters. • Reference - Yu, C. C. Autotuning of PID Controllers, • 1999, Springer, London
Proposed Ways to Get More Information • Run two tests: conventional and then with dynamic element • inserted to get another point on the Nyquist plot. • (Li et al; Ind. Eng. Chem. Research1991, 30 1530) • Two-channel test: use two relays in parallel, one with • conventional and one with integrator. • (Friman and Waller; Ind. Eng. Chem. Research 1997, 36, 2662)
Curve Shapes Deadtime in process affects shape of curve. Mentioned by (1) Astrom and (2) Friman and Waller. Nothing quantitative proposed by these authors. Basic Idea – use curve shape to find a third process parameter.
First-Order with Deadtime 0.5 Deadtime = 1 0.4 63% Gain = Kp = 0.5 With OP = 1 0.3 PV 0.2 0.1 Time constant = 2 0 0 2 4 6 8 10 Time (minutes)
First-order/deadtime process D=0.1 0.15 0.1 0.05 Y 0 -0.05 -0.1 0 0.2 0.4 0.6 0.8 1 1.2 1.4 1.6 1.8 2 Time D=1 1 0.5 Y 0 -0.5 -1 0 1 2 3 4 5 6 7 8 9 10 Time D=10 1 0.5 Y 0 -0.5 -1 0 10 20 30 40 50 60 70 80 90 Time
Curvature Factor = a Y a/2 0 time b t1 t2 Pu
a Pu a Y 0 F=2 time -a a Y a/2 0 time b t1 t2 Pu a Y 0 time F=0.5 Pu
Range of Possible F Factors • is from 0.5 to 2. • Can relate F Curvature Factor • to D Deadtime.
D/ 0.1 1 10 Relay-feedback Test: Pu 0.382 2.98 21.4 a 0.0952 0.632 1.0 b 0.0488 0.620 9.31 Ku 13.4 2.01 1.27 F=4b/Pu 0.511 0.832 1.74 IMC: 0.2 1.7 17 Kc 5.25 0.882 0.353 I 1.05 1.5 5.5
2 1.5 D = 1 1 Log10(D/) Pure Deadtime (D=) 0.5 0 -0.5 -1 Pure Integrator (D=0) -1.5 0.5 1 1.5 2 Curvature Factor = F = 4b/Pu
Proposed Procedure • Run relay-feedback test a, b and Pu • Calculate Ku=4h/a , u =2/Pu and F=4b/Pu • Calculate D/ from correlation with F. • Define D/ = c (c is known constant) One equation in unknown .
5. Calculate D = c 6. Calculate Kp 7. Now three process parameters are known: D, and Kp. 8. Use IMC tuning rules.
Effectiveness First-order with various deadtimes Third-order Inverse response Openloop unstable
First-Order; D=0.05 1.6 ZN 1.4 1.2 TL 1 Y005 0.8 IMC 0.6 0.4 0.2 0 0 0.2 0.4 0.6 0.8 1 1.2 1.4 1.6 1.8 2 Time 20 15 ZN 10 TL M005 5 IMC 0 -5 0 0.2 0.4 0.6 0.8 1 1.2 1.4 1.6 1.8 2 Time Fig. 5
First-Order; D=0.1 1.5 ZN IMC 1 TL Y01 0.5 0 0 0.2 0.4 0.6 0.8 1 1.2 1.4 1.6 1.8 2 Time 10 ZN 8 IMC 6 M01 4 TL 2 0 -2 0 0.2 0.4 0.6 0.8 1 1.2 1.4 1.6 1.8 2 Time Fig. 6
First-Order; D=1 1.4 1.2 IMC 1 0.8 ZN Y1 0.6 TL 0.4 0.2 0 0 1 2 3 4 5 6 7 8 9 10 Time 1.8 1.6 IMC 1.4 1.2 M1 1 ZN 0.8 TL 0.6 0.4 0 1 2 3 4 5 6 7 8 9 10 Time Fig. 7
First-Order; D=10 1 IMC 0.8 ZN 0.6 Y10 0.4 TL 0.2 0 0 10 20 30 40 50 60 Time 1 IMC 0.9 0.8 0.7 M10 ZN 0.6 0.5 TL 0.4 0.3 0 10 20 30 40 50 60 Time Fig. 8
Now test on third-order process. Actual process: Approximate process:
Third-Order; D=0.1 0.03 0.02 0.01 0 Y -0.01 -0.02 -0.03 0 2 4 6 8 10 12 14 16 18 20 Time Third-Order; D=1 0.1 0.05 0 Y -0.05 -0.1 0 5 10 15 20 25 30 Time Third-Order; D=10 0.2 0.1 0 Y -0.1 -0.2 0 10 20 30 40 50 60 70 80 90 Time Fig. 9
Third-Order; D=0.1 1.4 ZN 1.2 1 IMC 0.8 Y01 0.6 0.4 0.2 0 0 5 10 15 20 25 30 Time 25 ZN 20 15 M01 10 IMC 5 0 -5 0 5 10 15 20 25 30 Fig. 10 Time
Third-Order; D=1 1.4 1.2 ZN 1 0.8 IMC Y1 0.6 0.4 0.2 0 0 5 10 15 20 25 30 Time 11 ZN 10 9 8 M1 7 IMC 6 5 4 0 5 10 15 20 25 30 Time Fig. 11
Third-Order; D=10 1.4 1.2 IMC 1 0.8 Y10 0.6 ZN 0.4 0.2 0 0 10 20 30 40 50 60 70 80 90 Time 10 9 IMC 8 7 M10 6 ZN 5 4 3 0 10 20 30 40 50 60 70 80 90 Time Fig. 12
D=0.1; Inverse response 1.5 Tauz=1.6 1 0.5 Y 0 -0.5 Tauz=0.8 -1 -1.5 0 2 4 6 8 10 12 14 16 18 20 Time D=1; Inverse response 2 Tauz=1.6 1 Y 0 -1 Tauz=0.8 -2 0 2 4 6 8 10 12 14 16 18 20 Time D=10; Inverse response 2 Tauz=1.6 1 0 Y -1 Tauz=0.8 -2 0 10 20 30 40 50 60 70 80 90 Time Fig. 13
First-Order Unstable; D=0.1 0.2 0.1 Y1 0 -0.1 -0.2 0 0.2 0.4 0.6 0.8 1 1.2 1.4 1.6 1.8 2 Time First-Order Unstable; D=0.2 0.4 0.2 Y2 0 -0.2 -0.4 0 0.5 1 1.5 2 2.5 3 3.5 4 Time First-Order Unstable; D=0.3 0.4 0.2 Y3 0 -0.2 -0.4 0 1 2 3 4 5 6 Time Fig. 14
First-Order Unstable; D=0.1 2 IMC 1.5 TL Y1 1 ZN 0.5 0 0 0.5 1 1.5 2 2.5 3 3.5 4 4.5 5 Time 8 6 4 IMC TL 2 M1 0 -2 ZN -4 -6 0 0.5 1 1.5 2 2.5 3 3.5 4 4.5 5 Time Fig. 15
First-Order Unstable; D=0.2 4 IMC 3 TL 2 Y2 1 ZN 0 -1 -2 0 1 2 3 4 5 6 7 8 9 10 Time 4 3 2 TL 1 M2 0 -1 -2 ZN IMC -3 -4 0 1 2 3 4 5 6 7 8 9 10 Time Fig. 16
First-Order Unstable; D=0.3 3.5 3 TL 2.5 2 1.5 Y3 1 ZN 0.5 0 -0.5 -1 0 2 4 6 8 10 12 14 16 18 20 Time 3 2 ZN 1 0 M3 -1 -2 -3 TL -4 -5 0 2 4 6 8 10 12 14 16 18 20 Time Fig. 17
Conclusion Only one simple test required. Use shape of curve to deduce deadtime. Works for first and higher-order systems. Does not work for inverse response or unstable.