Download
1 / 22
220 likes | 241 Vues
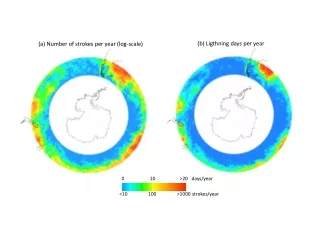
(b) Ligthning days per year. (a) Number of strokes per year (log- scale ). 0 10 >20 days / year. <10 100 >1000 strokes / year. Lightning days per year. 0 10 >20.

E N D
(b) Ligthningdays per year (a) Number of strokes per year (log-scale) 0 10 >20 days/year <10 100 >1000 strokes/year
Lightning days per year 0 10 >20
(a) Lightning days per year 0 10 >20 (b) Lightning density for year 2012
Lighting and weather in western Patagonia More stable (500 hPa) - (1000 hPa) Less stable (1000 hPa) Ligthging number (/20) Days, 2012
Lightning number in WP from WWLM All other products from NCEP/NCAR Reanalysis at 45°S, 75°W 30 20 10 0 -10 U850 (m/s) LTS (°C) Precipitation Index Ligthning number (/20) Days, 2012 Strong Westerlies, low stability but no lightning ???? Strong Westerlies, low stability and lots of lightning
Less stable More Stable Lightning quadrant All days Rainy days Lightning days Stronger westerlies Weak easterly
Chiloe Is. Madre de Dios Is.
Gray scale, -1500 +1700 H220; S40; B95
Ray freq: number of Ray in boxes of 0.1x0.1 lat-lon from 2005-2012 Black: from 7 to 49 every 7 Red: from 70 to inf. Every 21 number of Ray-days (at least on ray) in boxes of 0.2x0.2 lat-lon from 2005-2012 Black: from 0 to 300 every 15 >30 >75 >42 >28
(a) Annual mean precipitation (var. CI) (c) Lightning-day frequency (CI=15) (b) Lightning frequency (CI=7;21) 38°S 42°S 46°S 50°S 54°S 38°S 42°S 46°S 50°S 54°S Chiloe >30 >75 NPI >42 >10.000 mm m ASL SPI mm/year > 1800 900 0 > 6400 3200 1600 800 400 >28 >6.000 mm 76°W 72°W 68°W 66°W 76°W 72°W 68°W 66°W 76°W 72°W 68°W 66°W
(a) Annual mean precipitation (var. CI) (b) Lightning density (CI=7;21) 38°S 42°S 46°S 50°S 54°S 38°S 42°S 46°S 50°S 54°S >70 Chiloe >42 NPI >10.000 mm SPI m ASL mm/year >28 > 6400 3200 1600 800 400 > 1800 900 0 >6.000 mm 76°W 72°W 68°W 66°W 76°W 72°W 68°W 66°W Figure X. (a) Annual mean precipitation over southern South America from a regional model simulation (contoured at levels indicated in the color scale) and station data (colored circles, scale at right). The model simulation is PRECIS forced by ERA40 from 1979 to 2001 (see details in Garreaud et al. 2013). The station data is the average from 1960-1990 (variable record length). (b) Lightning density (number of lightning in 0.1° 0.1° lat-lon grid boxes) from Jan. 2005 to Dec. 2012. Interval is 7 from 0 to 50 (black contours) and 21 above 50 (red contours). Data from WWLN. In both panels terrain height (from SSTRM) in gray shading (color scale at bottom right of panel b). For reference, the location of the Northern and Southern Patagonia Ice Fields (NPI and SPI) and Chiloe island is indicated.
(a) Annual mean precipitation (var. CI) (b) Number of lightning-days (CI=15) 38°S 42°S 46°S 50°S 54°S 38°S 42°S 46°S 50°S 54°S 60 Chiloe 30 >30 NPI >75 >10.000 mm SPI m ASL mm/year > 6400 3200 1600 800 400 > 1800 900 0 >6.000 mm 76°W 72°W 68°W 66°W 76°W 72°W 68°W 66°W Figure X. (a) Annual mean precipitation over southern South America from a regional model simulation (contoured at levels indicated in the color scale) and station data (colored circles, scale at right). The model simulation is PRECIS forced by ERA40 from 1979 to 2001 (see details in Garreaud et al. 2013). The station data is the average from 1960-1990 (variable record length). (b) Number of lightning days (at least one lighting) in 0.2° 0.2° lat-lon grid boxes from Jan. 2005 to Dec. 2012. Contour interval is 15 days. Data from WWLN. In both panels terrain height (from SSTRM) in gray shading (color scale at bottom right of panel b). For reference, the location of the Northern and Southern Patagonia Ice Fields (NPI and SPI) and Chiloe island is indicated.
6hr GFS forecast valid at 24Z 06 Jan 2013. (b) Convective precipitation (mm/6h) and flash locations (a) Total precipitation (mm/6h) and Convective fraction 39°S 42°S 45°S 48°S 51°S 54°S m ASL m ASL 1200 1200 0 0 80% 81°W 75°W 69°W 81°W 75°W 69°W
CAPE @ 15 UTC from GFS analysis (Mark) Western Patagonia: 49.5°S, 76°W (CAPE); average = 41 J/Kg Central Argentina: 30°S, 65°W (CAPE); average = 227 J/Kg [J Kg-1]
CAPE promedio (año completo) Fracción de días con CAPE>50 J/Kg [J Kg-1] f 0.7 f 0