Direct Dump Tests
Direct Dump Tests. Modify. Direct BLMs installed and corrected, first calibration done. Dump signals now included in Logging DB: http ://issues.cern.ch/browse/CALS-112 EDMS ECR document: https:// edms.cern.ch/document/1159062/1

Direct Dump Tests
E N D
Presentation Transcript
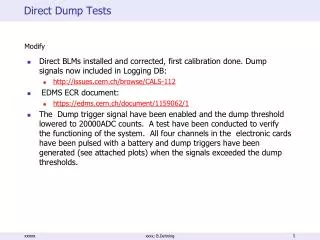
Direct Dump Tests Modify • Direct BLMs installed and corrected, first calibration done. Dump signals now included in Logging DB: • http://issues.cern.ch/browse/CALS-112 • EDMS ECR document: • https://edms.cern.ch/document/1159062/1 • The Dump trigger signal have been enabled and the dump threshold lowered to 20000ADC counts. A test have been conducted to verify the functioning of the system. All four channels in the electronic cards have been pulsed with a battery and dump triggers have been generated (see attached plots) when the signals exceeded the dump thresholds. xxxx; B.Dehning
Calculation of direct dump IC monitor thresholds • EBH 7.4.2011 • The calculation is based on asynchronous dump on 13.3.2011 at 3:11. The thresholds are to be set at 1.5 times the losses at this dump. Uncertainties in the threshold determination are estimated to more than a factor of 5. • Result: Dump thresholds should be put to an IC (without RC filter) signal of 0.034 A. This corresponds to 0.025 Gy in 40 us. The new threshold should be in the upper part of this dynamic range: about 75-80% up from the lower end of the dynamic range. • Line of calculation and arguments: • BLMEI.04L6.B2I10_TCDQA.B4L6.B2 is the monitor Ruediger pointed out. It has a big RC filter (~11ms time constant) . It sits directly between the two direct dump monitors for beam 2. The integrated loss over 1.3s is 0.025Gy/s in 1.3s. Times 1.5 (the factor from Ruediger) this gives 0.05 Gy as dump threshold. The reason for taking only 0.025 even though there are two equally high peaks in the display for 1.3s integration time is, that the loss must have happened during the overlap between two integration times, and is therefore completely covered in both integrals. (This effect can be seen also at the monitor BLMQI.04L6.B2I10_MQY, which does not have a filter and is not in saturation. Therefore the losses in the two integration times can be compared in the PM display). • From the monitors nearby without filter, e.g. BLMQI.04L6.B2I10_MQY, we can see that within 4 x 40us most of the charge is collected and that the dose rate (Gy/s) in the highest 40us is about a factor of 2 higher than the dose rate averaged over 4 x 40us. Therefore, the dose (Gy) in 40us is 2 x 0.05 Gy / 4 = 0.025 Gy. • The dump IC monitor has also no filter: 0.05 Gy in 320us corresponds to 0.025 Gy in the highest 40us. This corresponds to 0.034 A. The assumption here is that the IC + cable + input filter of the electronics smoothes out the current peak to about an equivalent of averaging over 40 us. The input filter of the direct dump electronics is currently using a low pass filter with a cutoff frequency of 6kHz (T=26,3us) for noise reduction. • Currently, the dump threshold is set to 13kGy/s. Assuming the same smoothing over 40 us, this corresponds to 0.5 Gy. This is a factor 20 higher than what we now calculated. Mariusz thinks that this is not something to worry about, as the last threshold estimate was very rough. • The dynamic range of the electronics is about a factor of 65000. It is a 16bit ADC => 65536 => 96dB (theoretical value!) . • Saturation effect at 1.36 uC is approximately a factor of 2 (from thesis of M.Stockner). But no correction for that is applied, because this saturation effect is also present in the monitor with the filter which we use to calculate the dose level (at approximately the same size, because the dose is nearly the same). • The DD monitors are not at the same location as the reference monitor. One of the DD monitors is directly next to another IC with big filter. It can be seen that for this DD location, the signal is approximately 3 times lower than for the reference monitor. Still, my proposal is not to apply a correction, as: • This factor depends on the details of the dump (it is close to 1 on a later dump this day) • For the second DD monitor the factor is unknown for the asynchronous beam dump and close to 1 on a later dump that day. • I’d propose to keep the thresholds on both monitors the same (not sure they can be set differently). • 2010 SEM Converting factor and Threshold of the BLMDD (from Ewald): • Threshold: 13kGray/s => 10uA => 5V => 32768 bits • Converting factor electronic current/bits: 0.396Gray/s/bit => 305pA/bit => 152.5uV/bit • Conversion Factor IC: 1 Gy = 54 uC xxxx; B.Dehning