INTODUCTION
3D IMAGING OF PAINT LAYERS IN ROMAN PERIOD PLASTER FRAGMENTS. 2. 1. 4. 3. 3. 1. 3. 3. Ch. Apostolaki, D. Wegrzynek, E. Chinea-Cano, V.Perdikatsis, R. Padilla-Alvarez, A. Markowicz, A.G. Karydas and H. Brecoulaki. 1.

INTODUCTION
E N D
Presentation Transcript
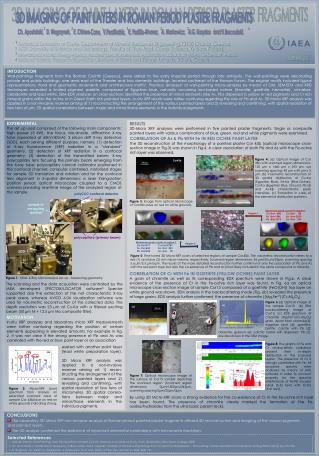
3D IMAGING OF PAINT LAYERS IN ROMAN PERIOD PLASTER FRAGMENTS 2 1 4 3 3 1 3 3 Ch. Apostolaki, D. Wegrzynek, E. Chinea-Cano, V.Perdikatsis, R. Padilla-Alvarez, A. Markowicz, A.G. Karydas and H. Brecoulaki. 1 Technical University of Crete, Department of Mineral Resources Engineering,73100 Chania, Greece. 2 AGH University of Science and Technology, Faculty of Phys. Appl. Comp. Science, Krakow, Poland. 3 International Atomic Energy Agency, Nuclear Spectrometry and Applications Laboratory (NSAL), Seiberdorf, Austria. TECHNART 2011 4 National Hellenic Research Foundation, Institute of Greek and Roman Antiquity, Athens, Greece. INTODUCTION Wall-paintings fragments from the Roman Corinth (Greece), were dated to the early Imperial period through late antiquity. The wall-paintings were decorating private and public buildings, one area east of the Theater and two domestic buildings, located southeast of the Roman Forum. The original motifs included figural representations, floral and geometric ornaments and architectural motifs1. Previous analyses2 of wall-painting micro-samples by means of OM, SEM-EDX and XRD techniques revealed a limited pigment palette, composed of Egyptian blue, naturally occurring iron-based ochres (limonite, goethite, hematite), cinnabar, celadonite and lead white. SEM-EDX analyses on cross-sections identified the presence of minor elements (like As, Pb) dispersed in yellow or red pigments and Cr rich mineral grains within the ochre or in Green Earth rich painted layers. In-situ XRF results were rather confusing regarding the role of Pb and As. 3D Micro XRF analysis was applied in a non-invasive manner aiming at:1) reconstructing the arrangement of the various painted layers and 2) revealing and confirming, with spatial resolution of few tens of μm, 3D spatial correlations between major and minor/trace elements in the individual pigments. EXPERIMENTAL The set up used comprised of the following main components: high power (3 kW), line focus, Mo-anode, diffraction X-ray tube (operated at 45kV/40mA); 3 silicon drift X-ray detectors (SDD), each serving different purpose, namely: (1) detection of X-ray fluorescence (XRF) radiation in a “standard” geometry, (2) detection of XRF radiation in a confocal geometry, (3) detection of the transmitted beam; X-ray polycapillary lens focusing the primary beam emerging from the X-ray tube; polycapillary conical collimator positioned in the confocal channel; computer controlled, motorized stages for sample 3D translation and rotation and for the confocal lens alignment in 3-spatial dimensions; a laser triangulation position sensor; optical microscope coupled to a CMOS camera providing real-time image of the analyzed region of the sample. RESULTS 3D-Micro XRF analyses were performed in five painted plaster fragments. Single or composite painted layers with various combinations of blue, green, red and white pigments were examined. CORRELATION OF As & Pb WITH Fe IN RED OCHRE PAINT LAYER The 3D reconstruction of the morphology of a painted plaster Cor 43b (optical microscope cross-section image in Fig.3) was shown inFig.4. A clear association of both Pb and As with the Fe-ochre rich layer was observed. Figure 4: (a) Optical image of Cor 43b with scanned region dimensions: 120 μm x 1440 μm x 293 μm, xyz scanning spacing: 40 μm x 40 μm x 3 μm; (b) Volumetric reconstruction of 3D spatial distribution of Cu-Kα (Egyptian Blue), Fe-Kα (Red Ochre), Ca-Kα (Egyptian Blue, Ground, Pb-Lβ and As-Kβ characteristic peak intensities; (c) Translation in z-axis of the elemental distribution patterns. Cor43b polyCCC confocal detector Figure 3: Image from optical microscope of Cor43b (blue on red on white ground). sample in measuring position Maximum peak counts in region 1 Ca-Ka= 408 Cu-Ka= 80 Fe -Ka=1946 As -Ka= 3029 Pb -Ka=1213 Zn- Ka= 365 Region 1 polycapillary (primary beam) Maximum peak counts in region 2 Ca-Ka=277 Cu-Ka=2787 Fe -Ka=645 As -Ka= 223 Pb -Ka=223 Zn- Ka= 70 Region 2 Figure 5: Fine-tuned 3D Micro-XRF scans of selected regions of sample Cor43b. The volumetric reconstruction refers to a red (1) and blue (2) rich micro-volume, respectively. Scanned region dimensions: 56 μm/55 μm/55μm, scanning spacing 5.6 μm/5.5 μm/5μm. The results of the more detailed reconstruction further confirm not only the association of Pb and As with the red paint layer but also the co-existence of Pb and As (most likely included in the same compound or mineral). CORRELATION OF Cr WITH Fe IN GOETHITE (YELLOW OCHRE) PAINT LAYER A grain of chromite as well as its corresponding EDX spectrum were shown inFig.6. A clear evidence of the presence of Cr in the Fe-ochre rich layer was found. In Fig. 6a an optical microscope cross-section image of sample Cor13 composed of a goethite (FeO(OH)) top layer on white ground was shown. SEM analysis in the backscattering mode (Fig. 6b) revealed the presence of large grains, EDX analysis further confirmed the presence of chromite ((Mg,Fe2+)(Cr,Al)2O4). Figure 1: NSAL X-Ray Microanalysis set-up - Measuring geometry. The scanning and the data acquisition were controlled by the IAEA developed SPECTOR/LOCATOR software3. Spector supported also the extraction of the net characteristic X-ray peak areas, whereas AVIZO 6.04 visualization software was used for volumetric reconstruction of the collected data. The depth resolution was 23 μm at Cu-Kα with a filtered exciting beam (50 µm Ni + 12.5 µm Mo composite filter). (a) Figure 6:(a) Optical image of the sample Cor13 (b) SEM backscattering image of Cor13, (c) EDX spectrum of chromite (Mg,Fe2+)(Cr,Al)2O4) grain. Apart from chromite[3]; egyptian blue [4]; goethite, biotite, calcite with Pb [5]; (b) (b) (c) 6 6 6 6 4 4 4 4 4 4 4 MOTIVATION In-situ XRF analyses and laboratory micro XRF measurements were rather confusing regarding the position of certain elements appearing in elevated amounts. For example in Fig. 2, it was not clear if the strong presence of Pb and As was correlated with the red or blue paint layer or an association chromite 7 7 7 7 7 7 7 3 3 3 3 3 5 5 5 5 5 5 SDD-2 dolomite, gypsum [6]; calcitic matrix with dispersed Pb [7], are also shown in the SEM image. (a) Figure 8: The graphs of Fe and Cr characteristic radiations present their in-depth distribution in the scanned region. The presence of Cr is strongly correlated with Fe. All acquired spectra were analyzed by means of AXIL software in order to account properly for the spectral interference of Fe-Kβ escape peak (5.32 keV) with Cr-Kα (5.41 keV). SDD-3 existed with another paint layer (lead white preparation layer). 3D Micro XRF analysis was applied in a non-invasive manner aiming at: 1) recon-structing the arrangement of the various painted layers and 2) revealing and confirming, with spatial resolution of few tens of micrometer, 3D spatial correla-tions between major and minor/trace elements in the individual pigments. SDD-1 X-ray tube Figure 7: Optical microscope image of the surface of Cor13 sample depicting the scanned region (Scanned region dimensions: 0μm/1500μm/243μm, scanning spacing 0μm/25μm/3μm. Figure 2: Micro-XRF (sum) spectrum from analysis on extended scanned area of sample Cor 43b(blue on red on white ground) indicating strong. By using 3D Micro-XRF scans a strong evidence for the co-existence of Cr in the Fe-ochre rich layer has been found. The presence of chromite clearly marked the formation of the Fe-oxides/hydroxides from the ultra basic parent rocks. • CONCLUSIONS • The laboratory 3D Micro XRF non-invasive analysis of Roman period painted plaster fragments offered 3D reconstruction and imaging of the various pigments and painted layers. • The 3D analysis confirmed the existence of important elemental correlations with micrometre resolution. Selected References 1. Lepinski, Roman Wall Paintings from Panayia Field, Ancient Corinth, Greece: A Contextual Study. Ph.D. Dissertation, Bryn Mawr College, 2008. 2. Ch. Apostolaki, V. Perdikatsis, E. Repuskou, H. Brecoulaki, and S. Lepinski, “Analysis of Roman wall paintings from ancient Corinth/Greece.” Proceedings of the international Conference Amireg 2006 Chania pp.729-734. 3.M. Bogovac, M. Jakšić, D. Wegrzynek, A. Markowicz, Nucl. Instr. Meth. in Phys. Res. Section A, 2009, 608, 157.