Download
1 / 69
690 likes | 810 Vues
The s tate of Victoria’s children report 2011. Grampians Region Summary of findings. Population – Victorian rural regions 2011 . Source: ABS Estimated Resident Population, 30 June 2011 Note: ERP data for 2011 is based on preliminary ABS estimates.

E N D
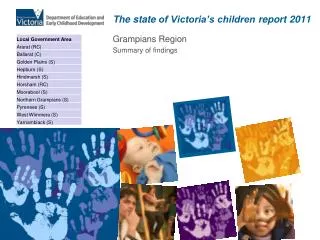
The state of Victoria’s children report 2011 Grampians Region Summary of findings
Population – Victorian rural regions 2011 Source: ABS Estimated Resident Population, 30 June 2011 Note: ERP data for 2011 is based on preliminary ABS estimates
Estimated resident population, by age group and region type, Victoria, 2011 Source: ABS Estimated Resident Population, 30 June 2011
Grampians total population by LGA, 2011 Source: ABS Estimated Resident Population, 30 June 2011
Grampians total population of children and young people aged 0-17 years by LGA, 2011 Source: ABS Estimated Residential Population, 30 June 2011
Distribution of children and young people aged 0-17 years across rural regions, 2011 Source: ABS Estimated Resident Population, 30 June 2011
Distribution of population of children and young people aged 0-17 years, across all Victorian regions, 2011 Source: ABS Estimated Resident Population, 30 June 2011
Indigenous population, 2006 • Source: ABSExperimental Estimates of the Indigenous Population, June 2006
Percentage of one-parent families with children and young people aged 0-17 years by region • Source: Census of Population and Housing 2011, ABS
Rate of Notification of vaccine preventable diseases (VPD), per 100,000 children and young people aged 0-17 years in Rural and Metropolitan Victoria, 2005-2010 • Source: The Notifiable Infectious Disease Surveillance System
Parents reading to children aged 0-12 months • Source: Victorian Children’s Health and Wellbeing Survey, 2009
Child has never been to the dentist, by age group and regions • Source: Victorian Children’s Health and Wellbeing Survey, 2009
Percentage of children entering primary school whose parents report their child had attended a dentist • Source: School Entrant Health Questionnaire, 2010?
Children 1-12 years drinking at least one cup of sugary drink per day • Source: The Victorian Child Health and Wellbeing Survey 2009
Children aged 4-12 years who eat the minimum recommended serves of fruit and vegetables every day, by region • For children aged 4-7 years: one serve of fruit and two serves of vegetables • For children aged 8-11 years: one serve of fruit and three serves of vegetables • For young people aged 12-18: three serves of fruit and four serves of vegetables • Source: The Victorian Child Health and Wellbeing Survey 2009
Children who do the recommended amount of physical activity every day, by age group and region • Source: The Victorian Child Health and Wellbeing Survey 2009
Young person has smoked cigarettes in the past 30 days • Source: The Victorian Adolescent Health and Wellbeing Survey (HowRU2009)
Young person aged 12-17 years reported that it is ‘easy/very easy’ to get alcohol, by regions • Source: The Victorian Adolescent Health and Wellbeing Survey (HowRU2009)
How did young people aged 12-17 years obtain the alcohol by regions (only looking at those that have consumed alcohol in the last 30 days) • Source: The Victorian Adolescent Health and Wellbeing Survey (HowRU2009)
Percentage of young people aged 15 -17 years who have had sexual intercourse • Source: The Victorian Adolescent Health and Wellbeing Survey (HowRU2009)
Young female use of contraception (sexually active females only) • Source: The Victorian Adolescent Health and Wellbeing Survey (HowRU2009)
Fertility rates of females aged 15 -19 years ( births per 1000 women) • Source: Department of Health, 2010, Victorian Perinatal Data Collection, unpublished
Sexually transmissible infections in young people aged 12 – 17 years (Rate per 100,000) • Source: The Notifiable Infectious Disease Surveillance System
Has young person aged 12 – 17 years smoked cigarettes in the past 30 days, by Metropolitan and Rural classification • Source: The Victorian Adolescent Health and Wellbeing Survey (HowRU2009)
Percentage of young people aged 12-17 years that have used marijuana or other illegal drugs, by regions • Source: The Victorian Adolescent Health and Wellbeing Survey (HowRU2009)
Percentage of children with a high risk of significant clinical problems at school entry, by region, 2011 • Source: Strengths and Difficulties Questionnaire (SDQ) used in the School Entrant Health Questionnaire (SEHQ)
Young people 12-17 years with the highest level of psychological distress, by regions • Source: The Victorian Adolescent Health and Wellbeing Survey (HowRU2009)
Percentage of children whose parents reported the child has an intellectual disability, developmental delay or learning disability, 2009-2011 • Source: School Entrant Health Questionnaire
Children with emotional or behavioural difficulties, by region • Source: The Victorian Child Health and Wellbeing Survey, 2009
Mothers of children aged under 2 years who ever drank alcohol in pregnancy, by region • Source: The Victorian Child Health and Wellbeing Survey 2009
Children aged under 2 years exposed to tobacco while in utero, by region • Source: The Victorian Child Health and Wellbeing Survey 2009
Young person aged 12-17 years has been identified as needing mental health services, by region • Source: The Victorian Adolescent Health and Wellbeing Survey (HowRU2009)
Has adolescent aged 12-17 ever been bullied? • Source: The Victorian Adolescent Health and Wellbeing Survey (HowRU2009)
Children 1-12 years with current asthma, by region • Source: The Victorian Child Health and Wellbeing Survey 2009
Kindergarten participation rates for children aged 4 years, by region • Source: Annual Confirmed Kindergarten Data Collection
Percentage of children who are developmentally vulnerable by region, (AEDI Domains: physical, social, emotional, communication and general knowledge) • Source: Australian Early Development Index, 2009
Student connectedness to school, Years 5&6 • Source: Student Attitude to School Survey
Student connectedness to school, Years 7 to 9 • Source: Student Attitude to School Survey
Percentage of students achieving national minimum standards – NAPLAN Reading, by LGA 2012
Percentage of students achieving national minimum standards – NAPLAN Numeracy, by LGA 2012
Average absence days, Government schools, Grampians region • Source: Student Absence Data Collection, CASES21 government school enrolment system
Apparent retention rate, Years 7 to 12, all schools 2012 • Source: February 2012 school census, all sectors
Educational aspirations, Year 9 by region • Source: The Victorian Adolescent Health and Wellbeing Survey (HowRU2009)
Educational aspirations 12-17 year olds, by Indigenous status • Source: The Victorian Adolescent Health and Wellbeing Survey (HowRU2009)
How interesting young people find their subjects, by year level and region • Source: The Victorian Adolescent Health and Wellbeing Survey (HowRU2009)
Year 12 or equivalent attainment at age 19 by LGA, 2007-2011 • Source: Victorian Curriculum and Assessment Authority (VCAA) and Skills Victoria administrative data, and Australian Bureau of Statistics Estimated Resident Population data
Destinations of Year 12 completers by LGA, 2012 Source: Source: On Track survey, 2012
Year 12 completers and early leavers looking for work, by region Source: Source: On Track survey, 2012
Reasons students would have stayed at school – Grampians region Source: On Track survey, 2012