GASB 67 & 68 Disclosures
550 likes | 928 Vues
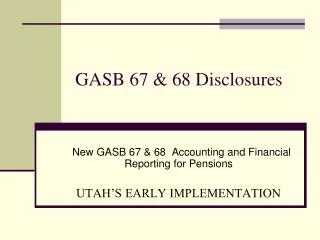
GASB 67 & 68 Disclosures. New GASB 67 & 68 Accounting and Financial Reporting for Pensions UTAH’S EARLY IMPLEMENTATION. URS. TIMELINE GASB 67 (Plan’s Accounting) Statement Adoption Fiscal Year Beginning After June 15, 2013

GASB 67 & 68 Disclosures
E N D
Presentation Transcript
GASB 67 & 68 Disclosures New GASB 67 & 68 Accounting and Financial Reporting for Pensions UTAH’S EARLY IMPLEMENTATION
URS TIMELINE GASB 67 (Plan’s Accounting) Statement Adoption Fiscal Year Beginning After June 15, 2013 GASB 68 (Employer’s Financial Accounting) Statement Adoption Fiscal Year Beginning After June 15, 2014
URS The new accounting changes will not alter the underlying fundamentals; $1,000 owed to a retired employee in ten years under the current standards will remain $1,000 owed in ten years under the new standards. The new accounting changes will not change how the actuary calculates contribution rates (amount employers are required to contribute). The new accounting changes will not change the amount you will need to budget for contributions to send to the Retirement System.
URS GASB 67 Major Changes to Pension Plans Financial Reporting
URS Statement of Fiduciary Net Assets now “Statement of Fiduciary Net Position” Statement of Changes in Fiduciary Net Assts now “Statement of Changes in Fiduciary Net Position” Net assets held in trust for pension benefits now “Net position restricted for pensions”
URS Additional footnote disclosures: Additional actuarial note disclosures Target asset class and long term expected rate of return Sensitivity of the Pension Liability to discount rate
URS Sensitivity of the Net Pension Liability to Changes in the Discount Rate Information for the plan year ending December 31, 2013 1.00% Current 1.00% Decrease Discount Rate Increase Utah Retirement System (6.5%) (7.50%) (8.50%) Total $7,851,845,798 $ 4,075,492,785 $927,757,521
URS Changes to Required Supplemental Information: “Schedule Changes in the Employers’ Net Pension Liability” “Schedule of the Employers’ Net Pension Liability” “Schedule of Employer Contributions” “Schedule of Money-Weighted Investment Return”
URS All Plans must use the Entry Age Normal actuarial cost method for financial reporting. Unfunded Actuarial Accrued Liability (now Net Pension Liability) now calculated using market value of assets instead of the actuarial value of assets. Actuary needs to calculate to see if Plan needs to use a “Blended” earnings assumption. New “Money Weighted” rate of return calculation.
URS GASB 68 Changes to Employers Financial Reporting for Pensions
URS Disconnect between pension accounting measurements and pension funding measurements. Employers will record a liability for their proportionate share of the cost-sharing plan’s collective net pension liability (NPL) as a liability on their balance sheets, rather than less prominently in the notes of the financial statements.
URS GASB determined that the Pension Plan is responsible for the benefits to the extent it has assets to pay benefits. Employer is responsible for portion of benefits not funded because the employer incurred a “Pension Obligation” as a result of the exchange of employee services for compensation.
URS New standard: Employers will show proportionate share NPL Total Pension Liability 12-31-13 $29,171,564,000 Assets at market 12-31-13 25,096,072,000 NPL 12-31-13 $ 4,075,493,000 Proportionate Share 4.5981944% XYZ City NPL $187,399,080
URS Employers Net Position All Retirement Systems (4) Plan Fiduciary (1) ( 2 ) ( 3 ) Net Position as Total Plan Employers a Percentage Pension Fiduciary Net Pension of the Total Date Liability Net Position Liability / (Asset) Pension Liability 12/31/10 $ 25,535,499 19,756,106 5,779,393 77.4 % 12/31/11 26,564,932 19,952,853 6,612,079 75.1 12/31/12 27,724,395 22,150,599 5,573,796 79.9 12/31/13 29,171,564 25,096,072 4,075,492 86.0
URS Old Standard: Employers only needed to report Annual Required Contribution (ARC) New Standard: Employers will now recognize their proportionate share of an actuarially calculated pension expense, which will no longer equal the statutorily required contribution, and it may be very volatile from year to year.
URS The new employer pension expense will contain the following main components: Normal cost (annual cost of current service), plus Interest on total pension liability, plus Changes in plan benefits, plus Amortization of experience gains/losses, changes in assumptions, less Expected return on plan assets.
Utah Retirement SystemsSchedules of Required Supplementary Information Schedule of Changes in Employers’ Net Pension LiabilityDecember 31,2013 $ in Thousands Total pension liability Service Cost $ 599,734,660 Interest 2,056,480,387 Benefit Changes 23,718,000 Difference between actual and expected experience (276,488,786) Assumption Changes 0 Benefit Payments (1,242,153,934) Refunds (4,948,749) Net Change in Total Pension Liability 1,156,341,578 Total Pension Liability - Beginning 28,015,222,761 Total Pension Liability - Ending (a) $ 29,171,564,339 Plan Fiduciary Net Position Contributions – Member 40,167,527 Contributions - Employer 889,485,826 Court Fees and Fire Insurance Tax 12,782,786 Net Investment Income 3,260,546,791 Benefit Payments (1,242,153,934) Refunds (4,948,749) Administrative Expense (10,400,941) Net Change in Plan Fiduciary Net Position 2,945,479,307 Plan Fiduciary Net Position - Beginning 22,150,592,247 Plan Fiduciary Net Position - Ending (b) $ 25,096,071,554 Net Pension Liability - Ending (a) - (b) $ 4,075,492,785 Plan Fiduciary Net Position as a Percentage of the Total Pension Liability 86.0% Covered Employee Payroll $ 4,669,558,417 Net Pension Liability as a Percentage of Covered Employee Payroll 87.3%
URS Calculation of Pension Expense Pension Expense • Service Cost $ 599,734,660 • - Interest Cost 2,056,480,387 • - Benefit Changes 23,718,000 • - Member Contributions (40,167,524) • - Projected Investment Earnings (1,649,869,422) • - Admin Expenses 10,400,938 • - Other 0 • - Deferred Outflow/(Inflow) due • to Liabilities (67,170,319) • - Deferred Outflow/(Inflow) due • to Assets (322,135,474) Total Pension Expense $ 610,991,246 XYZ City Pension Expense $31,391,493
URS Reconciliation Total Pension Expense 610,991,246 Employer contributions (902,268,612) Deferred Inflows (liability) (212,566,605) Deferred Inflows (assumption changes) - Deferred Outflows (liability) 3,248,138 Deferred Inflows (investment income) (1,288,541,896) Total Change in NPL (1,789,137,730) 29,171,564,339 -25,096,071,554 = 4,075,492,785 (NPL End of Period) 28,015,222,761-22,150,592,247 = 5,864,630,514 (NPL Beginning of Period) 4,075,492,785 – 5,864,630,515 = (1,789,137,730) (Change in NPL)
URS What will the AICPA Require Retirement Systems to include in the Plan CAFR for Employers and Auditors? For Cost Sharing Multiple Employer Plans: Schedule of Employer Allocations Schedule of Pension Amounts by Employer AICPA Guidance Issued in February
Employer Schedules Included in the URS CAFR (Cost Sharing Multiple Employer Only) Participating Employer Contributions Proportionate Share Total - System $ 4,075,492,785 100.0000% Employer 001 130,913 0.0147360% 002 40,849,861 4.5981944% 003 40,521 0.0045612% 004 72,622 0.0081746% 005 1,213,605 0.1366073% 006 743,328 0.0847971% 007 11,802 0.0013285% 008 18,247 0.0020539% 009 191,439,872 21.5490998% 460 30,049 0.086256%
Employer Schedules Included in the URS CAFR (Cost Sharing Multiple Employer Only) Schedule of Pension Amounts by Employer $ in Thousands . Deferred Outflows of Resources Deferred Inflows of Resources . Pension Expense Net Amortization of Deferred Amounts from Nett Changes in Changes in Changes in Difference Proportion Net Difference Proportion Proportion Between and Differences Between and Differences and Differences Projected Between Projected Between Between Difference and Actual Employer Difference and Actual Employer Proportionate Employer Between Investment Contributions Total Between Investment Contributions Total Share of Contributions Total Expected Earnings on and Proportionate Deferred Expected Earnings a on and Projected Deferred Plan and Projected Employer Net Pension and Actual Pension Plan Changes of Share of Outflows of and Actual Pension Plan Changes of Share of Inflows of Pension Share of Pension Entity . Liability Experience Investments AssumptionsContributions ResourcesExperience Investments AssumptionsContributions.ResourcesExpense Contributions Expense Total $4,076,452 3,248 - - - 3,248 208,522 1,242,426 - - 1,450,948 610,991 - 610,991 001 454 - - - - - 28 159 - - 187 102 - 102 002 199,390 - - - - - 9,604 57,603 - - 67,207 33,391 - 33,3391 003 209 - - - - - 10 60 - - 70 31 - 31 004 267 - - - - - 16 94 - - 110 55 - 55 005 4,190 1 - - - - 365 1,561 - - 1,926 887 - 887 006 3,616 - - - - - 177 1,045 - - 1,233 585 - 585 007 44 - - - - - 3 15 - - 18 9 - 9 008 67 - - - - - 4 24 - - 28 14 - 14 009 941,655 - - - - - 35,336 256,763 - - 292,099 142,640 - 142,640 460 111 - - - - - 7 39 - - 46 23 - 23
URS What will the AICPA Require Retirement Systems to include in the Plan CAFR for Employers and Auditors? For Single Employer and Agent Plans: Schedule of Changes in Fiduciary Net Position Schedule of Changes in the Employers' Net Pension Liability Guidance Not Finalized
Employer Schedules Included in the PERS CAFR (Single Employer and Agent Plans only) SINGLE EMPLOYER AND AGENTRETIREMENT SYSTEM S Schedules of Changes in Fiduciary Net Position by Division Year Ended December 31, 2013 With Comparative Totals for Year Ended December 31, 2012 (in thousands) State of Utah Salt Lake City OgdenProvoLoganBountiful Additions: Contributions : Member 103 13 - - 49 - Employer 43,393 12.426 2’525 2,158 944 716 Investment income: 121,520 29,378 6,973 5,204 3,047 2,271 Transfers 757 447 535 16 88 99 Total additions 165,773 42,264 10,033 7,378 4,128 3,086 Deductions: Pension benefits & Refunds 52,434 15,751 3,864 2,487 1,321 1,372 Administrative expense 413 110 26 19 10 8 Total deductions 52,847 15,861 3,890 2,506 1,331 1,380 Net increase 112,926 26,402 6,143 4,874 2,798 1,709 Net position restricted for benefits: Beginning of year 824,390 199,509 47,465 35.289 20,638 15,628 End of year 937,316 225,911 53,608 40,163 23,436 17,337
Employer Schedules Included in the PERS CAFR (Single Employer and Agent Plans only) Total pension liability Service Cost $ 26,012,671 Interest 81,712,831 Benefit Changes - Difference between actual and expected experience (2,099,277) Assumption Changes - Benefit Payments (52,432,713) Refunds (2,367) Net Change in Total Pension Liability 53,191,145 Total Pension Liability - Beginning 1,105,502,429 Total Pension Liability - Ending (a) $ 1,158,693,574 Plan Fiduciary Net Position Contributions - Employer $ 43,393,044 Contributions - Member 102.848 Net Investment Income 121,520,936 Benefit Payments (52,432,713) Refunds (2,367) Administrative Expense (413,431) Net transfers with affiliated systems 757,064 Other - Net Change in Plan Fiduciary Net Position 112,925,381 Plan Fiduciary Net Position - Beginning 824,389,729 Plan Fiduciary Net Position - Ending (b) $ 937,315,110 Net Pension Liability - Ending (a) - (b) $ 221,378,464 Plan Fiduciary Net Position as a Percentage of the Total Pension Liability 80.9% Covered Employee Payroll $115,959,504 Net Pension Liability as a Percentage of Covered Employee Payroll 190.9%
URS GASB 68 Expanded employer footnote disclosures will include: Basic information about the pension plans. Classes of employees covered. Information regarding pension liabilities, pension expense and deferred outflows and inflows of resources related to pensions. Significant assumptions including salary increase, inflation, discount rate, mortality, and experience studies. Target asset allocations and projected rate of return by asset class. Sensitivity of the net pension liability to the discount rate.
GASB 68 Sample Employer Pension Footnote XYZ City Notes to the Financial Statements for the Year Ended December 31, 2013 Summary of Significant Accounting Policies Pensions. For purposes of measuring the net pension liability, deferred outflows of resources and deferred inflows of resources related to pensions, and pension expense, information about the fiduciary net position of the Utah Retirement Systems Pension Plan (URS) and additions to/deductions from URS’s fiduciary net position have been determined on the same basis as they are reported by URS. For this purpose, benefit payments (including refunds of employee contributions) are recognized when due and payable in accordance with the benefit terms. Investments are reported at fair value. Note X General Information about the Pension Plan Plan description. Eligible plan participants are provided with pensions through the Utah Retirement Systems Public Employees Noncontributory (Noncontributory) Retirement System, the Public Employees (Contributory) Retirement System and the Tier 2 Public Employees Contributory Retirement System. The Noncontributory and Contributory Public Employees Retirement System and Tier 2 Public Employees Retirement Systems are a cost-sharing multiple-employer defined benefit pension plan administered by the Utah Retirement Systems. The Tier 2 Public Employees Contributory Retirement System became effective July 1, 2011. All eligible employees beginning on or after July 1, 2011, who have no previous service credit with any of the Utah Retirement Systems, are members of the Tier 2 Retirement System. Title 49 of the Utah Code grants the authority to establish and amend the benefit terms to the URS Board of Trustees (URS Board). URS issues a publicly available financial report that can be obtained by writing Utah Retirement Systems, 540 E. 200 S, Salt Lake City, Utah 84102 or visiting the website: www.urs.org.
GASB 68 Sample Employer Pension Footnote Benefits provided. URS provides retirement, disability, and death benefits. Retirement benefits are as follows: Summary of Benefits by System Tier 2 Contributory Noncontributory Contributory Public Employees Final Average Salary Highest 3 years Highest 3 years Highest 5 years Years of 30 years any age 30 years any age 35 years any age service required 25 years any age* 20 years age 60* 20 years any age and/or age 20 years age 60* 10 years age 62* 10 years age 62 eligible for 10 years age 62* 4 years age 65 4 years age 65 benefit 4 years age 65 1.25% per year to June 1975 Benefit percent per 2.0% per year 2.00% per year 1.5% per year year of service all years July 1975 to present all years
GASB 68 Sample Employer Pension Footnote Contributions. As a condition of participation in the Systems, employers and/or employees are required to contribute certain percentages of salary and wages as authorized by statute and specified by the URS Board. Contribution rates are as follows: Utah Retirement Systems Paid by Employer Employer Employer Contribution Paid for Employee Rates . January 1 - June 2013 Contributory System: Local governmental Division Tier1 1.00% 5.00% 14.27% Local Governmental Division Tier2 N/A N/A 15.06% Noncontributory System: Local Governmental Division Tier1 N/A N/A 18.76% July 1 - December 2013 Contributory System: Local Governmental Division Tier1 1.00% 5.00% 15.97% Local Governmental Division Tier2 N/A N/A 6.75% Noncontributory System: Local Governmental Division Tier1 N/A N/A 20.46%
GASB 68 Sample Employer Pension Footnote The required contributions and amounts paid into the plan for the 2013 fiscal year and the two previous years are as follows: Year Employer paid Salary subject Ended Employee paid or employee Employer to retirement 12/31 contributions contributions contributions contributions Noncontributory System: Local Governmental Division: 2013 - - $40,849,861 $199,657,192 2012 - - - - 2011 - - - - Defined Contribution System : 401(k) Plan 2013 $2,860,557 $3,363,764 2012 2,831,948 3,178,952 2011 2,761,013 2,999,488
GASB 68 Sample Employer Pension Footnote Pension Liabilities, Pension Expense, and Deferred Outflows of Resources and Deferred Inflows of Resources Related to Pensions At December 31, 2013, XYZ City reported a net pension liability of $187,399,808 Net Pension Liability Tier 1 Contributory Retirement System $ - Tier 1 Noncontributory Retirement System 185,423,058 Tier 2 Public Employees Contributory 1,976,022. Total Net Pension liability $ 187,399,080 The net pension liability was measured as of December 31, 2013, and the total pension liability used to calculate the net pension liability was determined by an actuarial valuation as of January 1, 2013. The XYZ City’s proportion of the net pension liability was based on a projection of the XYZ City’s long-term share of contributions to the pension plan relative to the projected contributions of all participating Local Governments. At December 31, 2013, the XYZ City’s proportion was 4.5981944% of the Noncontributory Retirement System For the year ended December 31, 2013, the XYZ City recognized pension expense of $37,405,578 1
GASB 68 Sample Employer Pension Footnote At December 31, 2013, the XYZ City reported deferred outflows of resources and deferred inflows of resources related to pensions from the following sources: Deferred Deferred Outflows of Inflows of Resources Resources Differences between expected and actual experience $ - $ 11,409,467 Changes in assumptions - - Net difference between projected and actual earnings on pension plan investments - 36,147,154 Changes in proportion and differences between City's contributions and proportionate share of contributions - - City's contributions subsequent to the measurement date 3,870,388 - . Total $ 3,870,388 $ 47,556,621
GASB 68 Sample Employer Pension Footnote The $3,870,388 reported as deferred outflows of resources related to pensions resulting from XYZ City contributions subsequent to the measurement date will be recognized as a reduction of the net pension liability in the year ended December 31, 2014. Other amounts reported as deferred outflows of resources and deferred inflows of resources related to pensions will be recognized in pension expense as follows: Deferred Outflows (Inflows) of Resources Year Ended December 31, 2014 $ (11,410,299) 2015 (11,410,299) 2016 (11,410,299) 2017 (11,410,299) Thereafter (1,915,423)
GASB 68 Sample Employer Pension Footnote Actuarial assumptions. The total pension liability in the December 31, 2013, actuarial valuation was determined using the following actuarial assumptions, applied to all periods included in the measurement: Inflation: 2.75 percent Salary increases: 3.75 percent, average, including inflation Investment rate of return: 7.50 percent, net of pension plan investment expense, including inflation Active member mortality rates are a function of the member’s gender, occupation, and age and are developed based upon plan experience. Retiree mortality for male retirees is based upon 100% of the RP-2000 Combined for Healthy Males with white collar adjustments, projected with a scale of from AA from 2000. Mortality for female is 120% of rates in Gabriel Roeder & Smith table based upon female teacher experience, projected with Scale of AA for 2000. The actuarial assumptions used in the January 1, 2013, valuation were based on the results of an actuarial experience study for the five year period of January 1, 2005 – December 31, 2010.
GASB 68 Sample Employer Pension Footnote The long-term expected rate of return on pension plan investments was determined using a building-block method in which best-estimate ranges of expected future real rates of return (expected returns, net of pension plan investment expense and inflation) are developed for each major asset class. These ranges are combined to produce the long-term expected rate of return by weighting the expected future real rates of return by the target asset allocation percentage and by adding expected inflation. The target allocation and best estimates of arithmetic real rates of return for each major asset class are summarized in the following table: Utah Retirement Systems Long-term expected real Asset Class Target rate of return Fixed Income 20% 1.00% Equities, domestic 23% 6.75% Equities, international 17% 7.25% Real estate 13% 5.00% Private equity 9% 10.25% Alternative investments 18% 3.50% Cash 0% 0.25% Total 100%
GASB 68 Sample Employer Pension Footnote The 7.50% assumed investment rate of return is comprised of an inflation rate of 2.75%, a real return of 5.10%, for a gross return of 7.85%. This is offset by 0.35% for investment and administrative expenses. Discount rate. The discount rate used to measure the total pension liability was 7.50 percent. The projection of cash flows used to determine the discount rate assumed that employee contributions will be made at the current contribution rate and that contributions from Local Government XYZ City's will be made at contractually required rates, actuarially determined. Based on those assumptions, the pension plan's fiduciary net position was projected to be available to make all projected future benefit payments of current active and inactive employees. Therefore, the long-term expected rate of return on pension plan investments was applied to all periods of projected benefit payments to determine the total pension liability.
GASB 68 Sample Employer Pension Footnote Sensitivity of the XYZ City's proportionate share of the net pension liability to changes in the discount rate. The following presents the XYZ City's proportionate share of the net pension liability calculated using the discount rate of 7.50 percent, as well as what the XYZ City's proportionate share of the net pension liability would be if it were calculated using a discount rate that is 1-percentage-point lower (6.50 percent) or minus 1 percentage-point higher (8.50 percent) than the current rate: 1% Discount 1% Decrease Rate Increase (6.50%) (7.50%) (8.50%) XYZ's proportionate share of the net pension liability $429,891,697 $269,900,959 $136,135,712 Pension plan fiduciary net position. Detailed information about the pension plan's fiduciary net position is available in the separately issued URS financial report Payables to the pension plan [If the XYZ City reported payables to the defined benefit pension plan, it should disclose information required by paragraph 122 of GASB 68.]
URS Require Supplementary Information (RSI) Two or three separate schedules are going to be required 1. Schedule of The Net Pension Liability (for ten years) 2. Schedule of Employer Contributions (for ten years) 3. Schedule of changes in Net Pension Liability (for single employer and agent plans only)
GASB 68 Sample Employer RSI Schedule of Required Supplementary Information Schedule of XYZ City Proportionate Share of the Net Pension Liability Utah Retirement Systems 31-Dec-13 Local Govt. Last 10 Fiscal Years Noncontributory XYZ City proportion of the net pension liability 4.598% XYZ City's proportionate share of the net pension liability (asset) $ 187,399,080 XYZ City's covered employee payroll 195,300,230 XYZ City's proportionate share of the net pension liability (asset) as a percentage of its covered-employee payroll 94% Plan fiduciary net position as a percentage of the total pension liability 86.0% * Amounts presented for each fiscal year were determined as of 12/31. A full 10-year schedule will be displayed as it becomes available.
GASB 68 Sample Employer RSI Schedule of Required Supplementary Information Schedule of XYZ City Contributions Utah Retirement Systems 31-Dec-13 Last 10 Fiscal Years* Tier 1Noncontributory Contractually required contribution $ 37,398,375 Contribution in relation to the contractually required contribution (37,398,375) . Contribution deficiency (excess) - . Covered employee payroll $ 195,300,230 Contributions as a percentage of covered-employee payroll 19.15% * Amounts Presented for each fiscal year were determined as of 12/31/2013 Additional years will be presented as they become available
Utah Retirement SystemSchedules of Required Supplementary Information(for Single Employer and Agent Plans Only)Schedule of Changes in the Employers' Net Pension Liability Total pension liability Service Cost $ 4,537,089 Interest 12,923,941 Benefit Changes - Difference between actual and expected experience (1,621,956) Assumption Changes - Benefit Payments (9,135,000) Refunds - Net Change in Total Pension Liability 6,704,605 Total Pension Liability - Beginning 175,934,986 Total Pension Liability - Ending (a) $ 182,639,051 Plan Fiduciary Net Position Contributions - Employer $ 4,232,000 Contributions - Member - Court Fees 1,666,000 Net Investment Income 17,151,000 Benefit Payments (9,135,000) Refunds - Administrative Expense (66,000) Net transfers with affiliated systems 710,000 Other - Net Change in Plan Fiduciary Net Position 12,892,000 Plan Fiduciary Net Position - Beginning 123,235,000 Plan Fiduciary Net Position - Ending (b) $ 136,127,000 Net Pension Liability - Ending (a) - (b) 46,512,051 Plan Fiduciary Net Position as a Percentage of the Total Pension Liability 76.2% Covered Employee Payroll $864,838,383 Net Pension Liability as a Percentage of Covered Employee Payroll 116.8%
GASB 68 Sample Employer RSI Notes to Required Supplementary Informationfor the Year Ended December 31, 2013 Changes of assumptions. If there were any changes to actuarial assumptions, they would be reported in this area.
URS New GASB Standards 67 & 68 Current GASB Standards 25 & 27 Implications
URS Current GASB Standard Pension expense reported by employers is equal to the URS contribution rate. GASB 68 New Standard Pension expense is the change in net pension liability each year with some deferral on certain items. Implications Employers annual contributions will no longer equal their pension expense.
URS Current GASB Standard Unfunded Actuarial Liability does not impact individual employers’ financial statements. GASB 68 New Standard Employer is responsible for Net Pension Liability and must show proportionate share on its individual balance sheet. Implications Employers go from no liability on their books to potentially large liability. Potential for confusion and misunderstanding by financial statement readers. Real impact is unclear at this time.
URS Current GASB Standard Expense based on UAL using actuarial value of assets. GASB 68 New Standard NPL is calculated using fair market value of plan net assets. Implications Will likely add volatility to both the NPL and pension expense.
URS Current GASB Standard Actuarial cost method used by Plan for funding calculations is used for ARC (accounting) calculations. GASB 67 New Standard All Plans must use Entry Age Normal actuarial cost method. Implications No real impact for URS as Entry Age Normal already used for valuation.
Current GASB Standard All projected benefit payments are discounted using one rate – the long term expected investment rate of return. GASB 67 New Standard Blended rate consisting of: 1. Investment return assumption 2. Municipal bond rate Higher rate (assumed rate of return) can be used only for period during which assets are sufficient to cover benefit payments (prior to projected exhaustion date). Lower municipal bond rate must be used to discount benefit payments after projected exhaustion date. Implications Use of lower discount rate would mean higher liabilities and pension expense on employer’s financial statements. Most troublesome for plans with fixed contribution rate or plans contributing less than the full actuarial contribution rate. Requires a projection of assets to determine exhaustion date if any.
URS Current GASB Standard Unfunded liabilities can be amortized over a maximum of 30 years which may be an “open” amortization period • Unfunded liabilities created by plan changes that affect active liabilities, such as benefit improvements, can be amortized over a maximum of 30 years. • Unfunded liabilities created by plan changes that affect retirees, such as mortality assumptions, can also be amortized over a maximum of 30 years.
URS GASB 68 New Standard Amortization periods will be significantly shorter (average remaining working lifetime of active employees) so cost recognized more quickly. Actuarial gains and losses and changes in actuarial assumptions will be amortized over the expected remaining working lifetime of active employees. Investment gains or losses will be amortized over 5 years.