1 / 1

Figure 6. Infant, neonatal, and postneonatal mortality rates: United States, 1940-2005

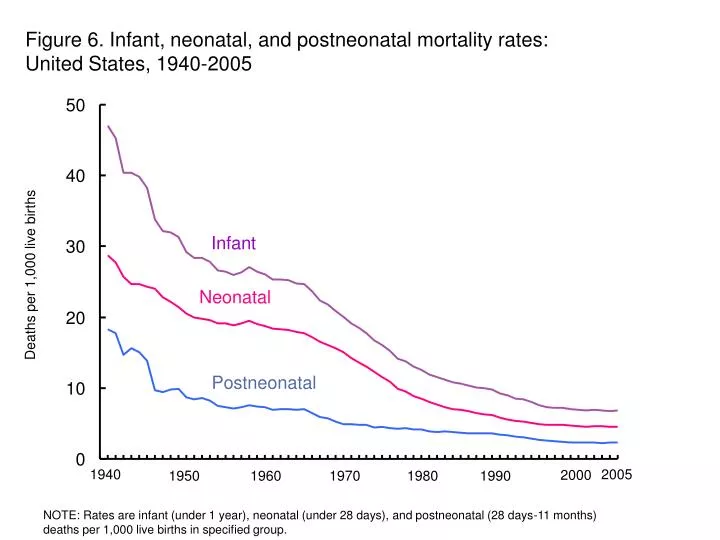
Figure 6. Infant, neonatal, and postneonatal mortality rates: United States, 1940-2005. Infant. Deaths per 1,000 live births. Neonatal. Postneonatal. 1940. 2005. 2000. 1950. 1960. 1970. 1980. 1990.

aidan-sweet
Télécharger la présentation

Figure 6. Infant, neonatal, and postneonatal mortality rates: United States, 1940-2005

An Image/Link below is provided (as is) to download presentation Download Policy: Content on the Website is provided to you AS IS for your information and personal use and may not be sold / licensed / shared on other websites without getting consent from its author. Content is provided to you AS IS for your information and personal use only. Download presentation by click this link. While downloading, if for some reason you are not able to download a presentation, the publisher may have deleted the file from their server. During download, if you can't get a presentation, the file might be deleted by the publisher.

E N D

Presentation Transcript


  1. Figure 6. Infant, neonatal, and postneonatal mortality rates: United States, 1940-2005 Infant Deaths per 1,000 live births Neonatal Postneonatal 1940 2005 2000 1950 1960 1970 1980 1990 NOTE: Rates are infant (under 1 year), neonatal (under 28 days), and postneonatal (28 days-11 months) deaths per 1,000 live births in specified group.

More Related