Download
1 / 8
80 likes | 406 Vues
A. B. NRAS(Q61K). BRAF(V600E). SK-Mel-173 – NRAS (Q61K). SK-Mel-364 – BRAF(V600E). SK-Mel-30. SK-Mel-173. SK-Mel-118. SK-Mel-285. SK-Mel-113. MeWo. SK-Mel-187. WM1361. WM1382. SK-Mel-326. SK-Mel-304. SK-Mel-364. Malme3M. SK-Mel-266 – NF1-null. SK-Mel-239. Malme3M. M308.

E N D
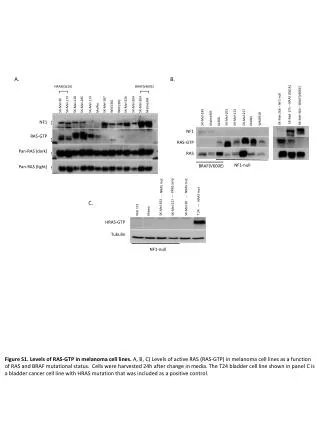
A. B. NRAS(Q61K) BRAF(V600E) SK-Mel-173 – NRAS (Q61K) SK-Mel-364 – BRAF(V600E) SK-Mel-30 SK-Mel-173 SK-Mel-118 SK-Mel-285 SK-Mel-113 MeWo SK-Mel-187 WM1361 WM1382 SK-Mel-326 SK-Mel-304 SK-Mel-364 Malme3M SK-Mel-266 – NF1-null SK-Mel-239 Malme3M M308 SK-Mel-103 SK-Mel-113 SK-Mel-217 MeWo WM3918 NF1 NF1 RAS-GTP RAS-GTP Pan-RAS (dark) RAS NF1-null BRAF(V600E) Pan-RAS (light) KRAS amp NRAS mut NRAS mut HRAS mut C. Mewo Mel 113 SK-Mel-103 T 24 SK-Mel-217 SK-Mel-30 HRAS-GTP Tubulin NF1-null Figure S1. Levels of RAS-GTP in melanoma cell lines. A, B, C) Levels of active RAS (RAS-GTP) in melanoma cell lines as a function of RAS and BRAF mutational status. Cells were harvested 24h after change in media. The T24 bladder cell line shown in panel C is a bladder cancer cell line with HRAS mutation that was included as a positive control. Nissan MH- NF1 in melanoma
A. Malme3M (BRAF V600E) SK-Mel-239 (BRAF V600E) SK-Mel-113 (NF1-null) SK-Mel-103 (NF1-null, NRAS (Q61R)) MeWo (NF1-null) SK-Mel-217 (NF1-null; KRAS amp) [PD0325901] 50 nM 500 nM 50 nM 500 nM 50 nM 500 nM 50 nM 500 nM 50 nM 500 nM 50 nM 500 nM Time(hrs) 1 6 24 0 1 6 24 1 6 24 1 6 24 0 1 6 24 1 6 24 0 1 6 24 0 1 6 24 1 6 24 0 1 6 24 1 6 24 0 1 6 24 pMEK MEK pERK ERK Cyclin D1 Figure S2. Changes in pERK and cyclin D1 levels as function of time in cells treated with the MEK inhibitor PD0325901.Melanoma cell lines were treated with 50 or 500nM of the MEK inhibitor PD0325901 for 0, 1, 6 or 24 hours. Changes in pMEK, MEK, pERK, ERK and cyclin D1 were quantitated by immunoblot. Nissan MH- NF1 in melanoma
A. B. 50nM PD0325901 + 2μM MK2206 SK-Mel-113 2μM MK2206 50nM PD0325901 0 1 6 1 6 24 1 6 24 24 (hours) pERK ERK pAKT (S473) AKT α-Tubulin Figure S3. Sk-Mel-113 (NF1 null) melanoma cells are resistant to AKT inhibition. A) Changes in pAKTand pERKlevels as a function of time post-treatment with 50 nM PD0325901 (MEK inhibitor), 2μM MK2206 (AKT inhibitor), or the combination. B) Viable cell count following 5 days of treatment with 50nM PD0325901 (MEK inhibitor), 2μM MK2206 (AKT inhibitor), or the combination. Nissan MH- NF1 in melanoma
A 50nM PD0325901 50nM trametinib 50nM trametinib 50nM PD0325901 (h) 0 1 6 24 6 24 1 0 1 6 24 6 24 1 BRAF(V600E) SK-Mel-239 SK-Mel-113 NF1 null MeWo SK-Mel-103 MEK pMEK (S217/221) B SK-Mel-239 (BRAF V600E) SK-Mel-113 (NF1-null) 0 3 10 30 100 300 (nM) 0 3 10 30 100 300 (nM) PD0325901 Trametinib AZD6244 MEK162 pERK pERK C D MeWo (NF1-null) 50 nM trametinib 1 μM AZD6244 50nM MEK162 (h) 0 1 6 24 1 6 24 1 6 24 pMEK MEK pERK ERK Figure S4.Variability in induction of pMEK levels following exposure to four allosteric MEK inhibitors. A) pMEK and total MEK levels were measure by immunoblot in NF1-null or BRAF (V600E) cells following treatment with 50nM PD0325901 or 50nM trametinib for 0, 1, 6 or 24 hours. B) Change in pERK levels as a function of drug concentration in Sk-Mel-239 and Sk-Mel-113 cells. Cells were treated with PD0325901, trametinib, AZD6244 or MEK162 and collected at 1 hour. C) Quantitation of (B) by densitometry. Percentages were calculated using the equation 100*([value of dose]-[value of background])/([value of 0nM]-[value of background]). D) Differences in the induction of pMEK by trametinib, AZD6244 and MEK162 inMeWo (NF1 null) cells. Nissan MH- NF1 in melanoma
M308 BRAF V600E, NF1 Q1070* (89% / 243) Figure S5. Exon-capture deep sequencing via IMPACT of the NF1 gene in M308 shows a nonsense Q1070* mutation. Nissan MH- NF1 in melanoma
RasGTP in A375 +/- siNF1 with 2 μM vemurafenib A B SK-Mel-239 BRAF (V600E) Transfection ctl No DNA HA-NRAS(G12V) Normalized RasGTP levels (hours) 0 1 6 24 0 1 6 24 pMEK MEK Hours with Vemurafenib No TRFCT pERK No siRNA siNT siNF1 0 1 6 24 0 1 6 24 (hours) ERK NF1 HA RAS-GTP C * = p<0.01 for each shNF1 vsshNT Figure S6.Expression of activated RAS is sufficient to confer resistance to vemurafenib in Sk-Mel-239 (BRAF V600E) cells. A) SK-Mel-239 cells were transfected with constitutively active NRAS (G12V) or a no-DNA transfection control. Cells were then treated with 2μM vemurafenib for 0, 1, 6, or 24 hours. B) Quantification of activated RAS (RAS-GTP) in a BRAF (V600E) mutant melanoma cell line (A375) following knockdown of NF1 by siRNA and treatment with 2μM vemurafenib. Controls include non-targeting (siNT), no transfection (no TRFCT), and no siRNA. RAS-GTP values normalized to no-siRNA control. C) Total cell counts following 4 days of treatment with increasing concentrations of vemurafenib (nM) following NF1 knockdown with three different shRNAs. shRNA targeting NF1 or a NT control were expressed under a tet-on promoter. Values shown represent percent DMSO control. Error bars are SEM, n=3. Nissan MH- NF1 in melanoma
A B A375 (BRAF V600E) 2μM vemurafenib 0 1 6 24 (hours) pMEK MEK pERK ERK C D SK-Mel- 239 SK-Mel-113 A375 M308 RAS-GTP RAS BRAF(V600E) NF1-null Figure S7. Sensitivity of A375 (BRAFV600E) cells to vemurafenib. A) A375 cells were treated with 2μM vemurafenib for 0, 1, 6, or 24 hours and downstream RAF effectors were assessed by immunoblot. B) A375 cells were treated with increasing doses of vemurafenib and cell numbers were quantitated at 0, 3, or 5 days. Error bars are SEM, n=3. C) BRAF (V600E) mutant M308, A375 and SK-Mel-239 cells were treated with increasing doses of vemurafenib for 5 days, and percent cell growth was plotted as a function of drug concentration. D) Quantitation of active RAS levels in A375, SK-Mel-239, M308 and SK-Mel-113. Nissan MH- NF1 in melanoma
Figure S8. The MAPK pathway and the inhibitors used in the study of NF1-null cells Nissan MH- NF1 in melanoma