Download

1 / 16
0 likes | 9 Vues
Graphical models express probability distributions by graphs, essential for inference but computationally challenging. Markov Chain Monte Carlo (MCMC) and Belief Propagation (BP) are popular algorithms for approximating the partition function. This study proposes a novel approach synthesizing MCMC and BP to leverage their respective strengths in estimating BP error using MCMC. The algorithms developed for approximating loop series show promising results, providing efficient estimations for 2-regular and full loop series. Experimental comparisons with BP showcase the effectiveness of the synthesized MCMC-BP approach.

E N D
Synthesis of MCMC and Belief Propagation Sungsoo Ahn(speaker)1, Michael Chertkov2, Jinwoo Shin1 1Korea Advanced Institute of Science and Technology (KAIST) 2Los Alamos National Laboratory (LANL) Neural Information Processing Systems (NIPS), December 6th, 2016

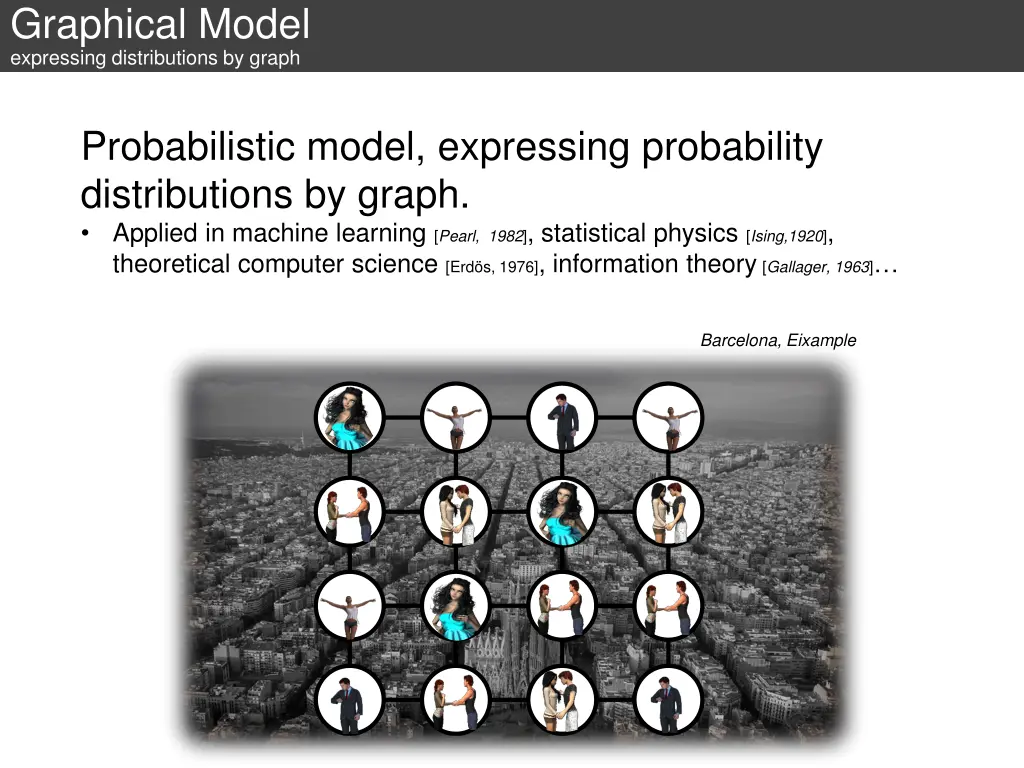
Graphical Model expressing distributions by graph Probabilistic model, expressing probability distributions by graph. • Applied in machine learning [Pearl, 1982], statistical physics [Ising,1920], theoretical computer science [Erdös, 1976], information theory [Gallager, 1963]… Barcelona, Eixample
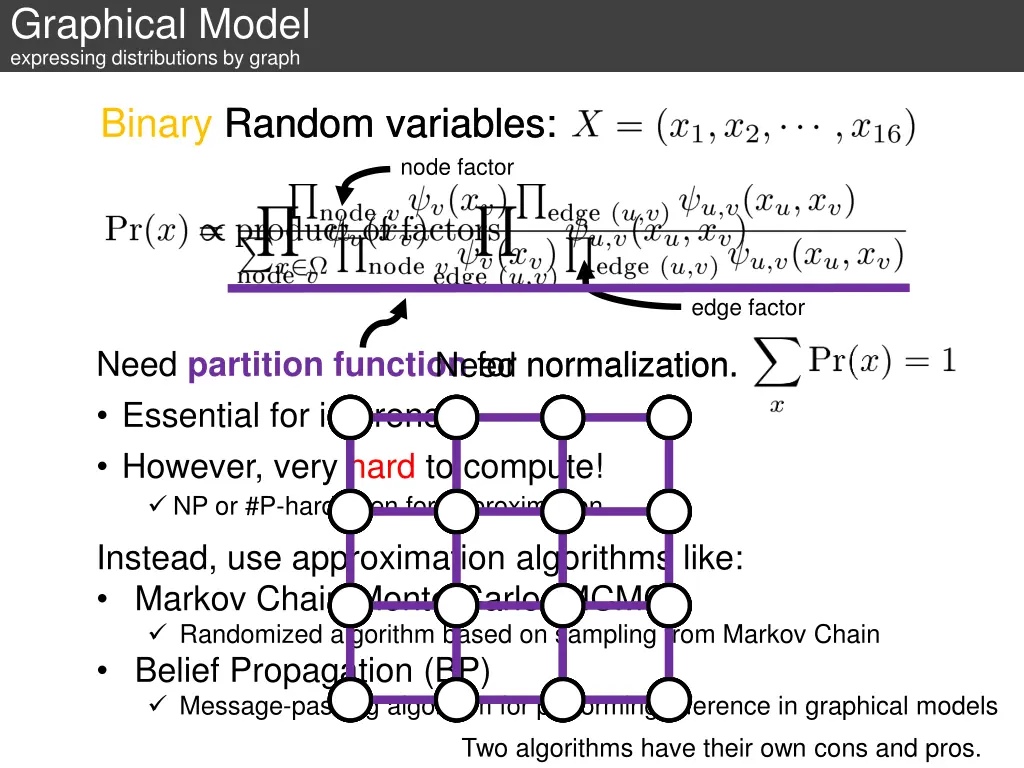
Graphical Model expressing distributions by graph Binary Random variables: Random variables: node factor edge factor Need partition function for normalization. • Essential for inference • However, very hard to compute! NP or #P-hard even for approximation 0 Instead, use approximation algorithms like: • Markov Chain Monte Carlo (MCMC) Randomized algorithm based on sampling from Markov Chain • Belief Propagation (BP) Message-passing algorithm for performing inference in graphical models Two algorithms have their own cons and pros. Need normalization. 1 0 1 1 1 1 1 0 0 0 1 1 1 1 0
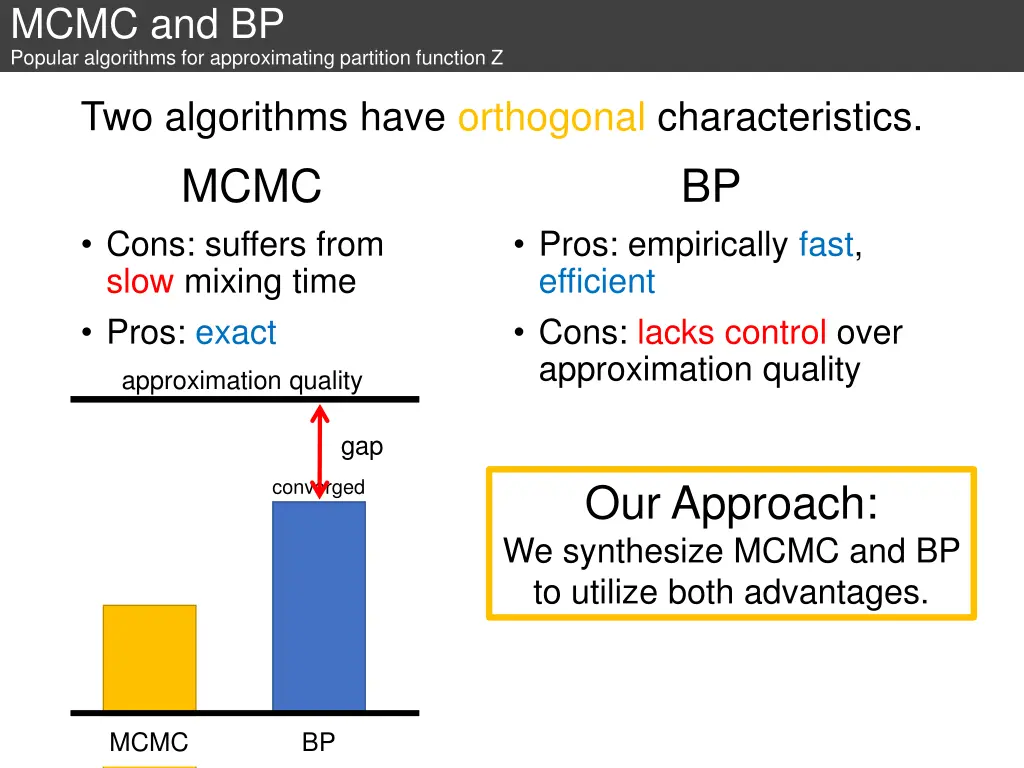
MCMC and BP Popular algorithms for approximating partition function Z Two algorithms have orthogonal characteristics. MCMC BP • Cons: suffers from slow mixing time • Pros: exact • Pros: empirically fast, efficient • Cons: lacks control over approximation quality approximation quality gap converged Our Approach: We synthesize MCMC and BP to utilize both advantages. MCMC BP
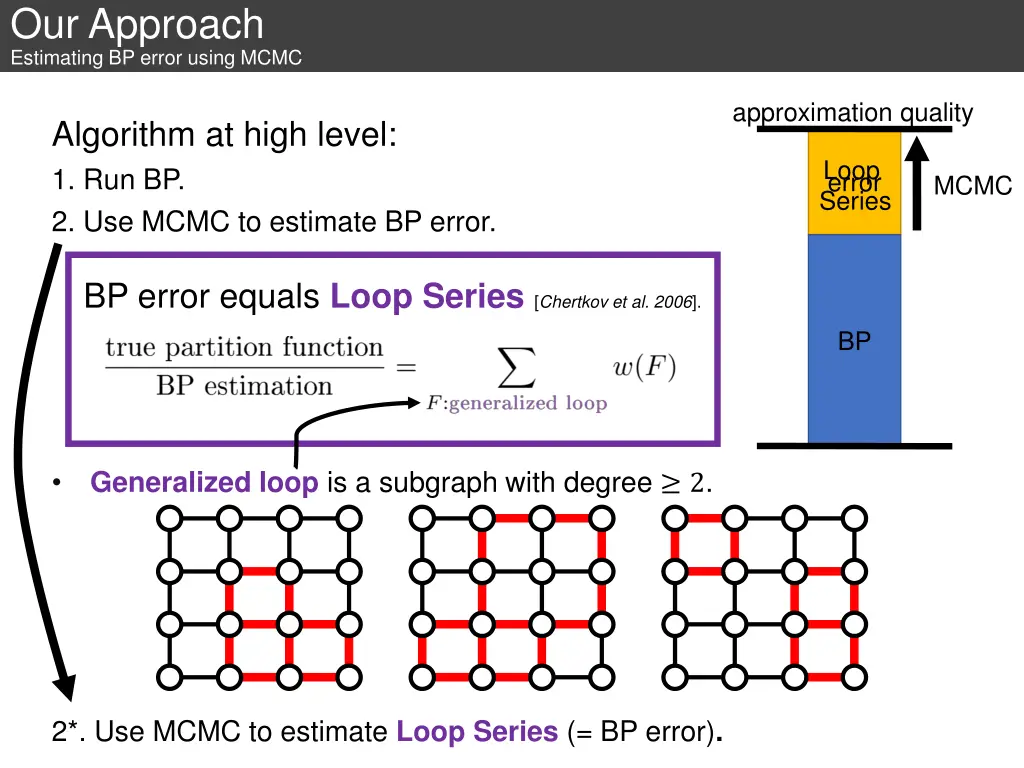
Our Approach Estimating BP error using MCMC approximation quality Algorithm at high level: 1. Run BP. 2. Use MCMC to estimate BP error. Loop error Series MCMC BP error equals Loop Series [Chertkov et al. 2006]. BP Generalized loop is a subgraph with degree ≥ 2. • 2*. Use MCMC to estimate Loop Series (= BP error).
Our Approach Estimating BP error using MCMC However, designing a provably efficient MCMC for loop series is hard! Our Main Contribution: We develop two algorithms for approximating Loop Series: 1. MCMC for estimating 2-regular loop series Polynomial-time mixing truncated version of loop series (≈ BP error). MCMC for estimating 2. MCMC for estimating full loop series Empirically efficient MCMC for estimating exact loop series (= BP error).
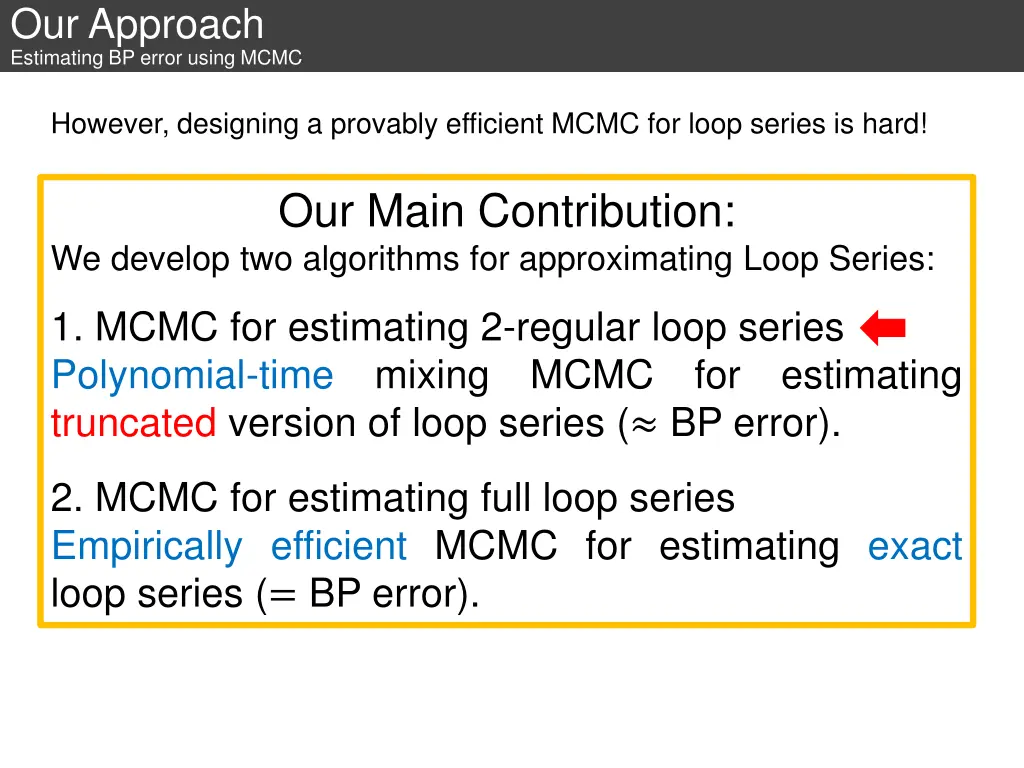
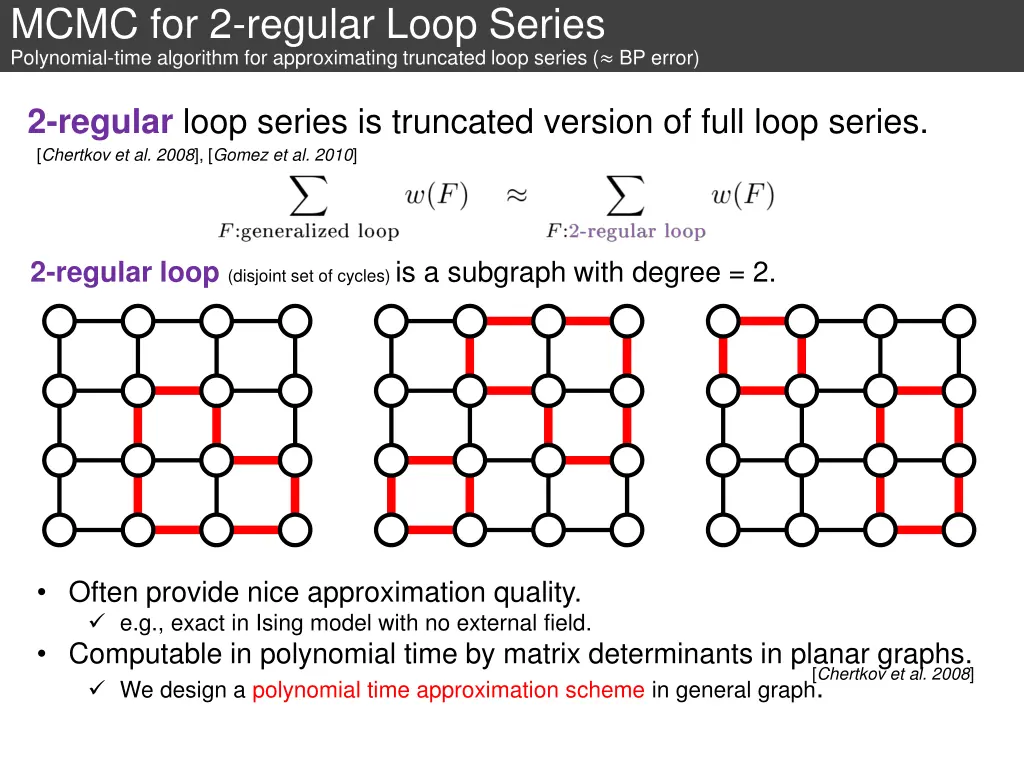
MCMC for 2-regular Loop Series Polynomial-time algorithm for approximating truncated loop series (≈ BP error) 2-regular loop series is truncated version of full loop series. [Chertkov et al. 2008], [Gomez et al. 2010] 2-regular loop (disjoint set of cycles) is a subgraph with degree = 2. • Often provide nice approximation quality. e.g., exact in Ising model with no external field. • Computable in polynomial time by matrix determinants in planar graphs. We design a polynomial time approximation scheme in general graph. [Chertkov et al. 2008]
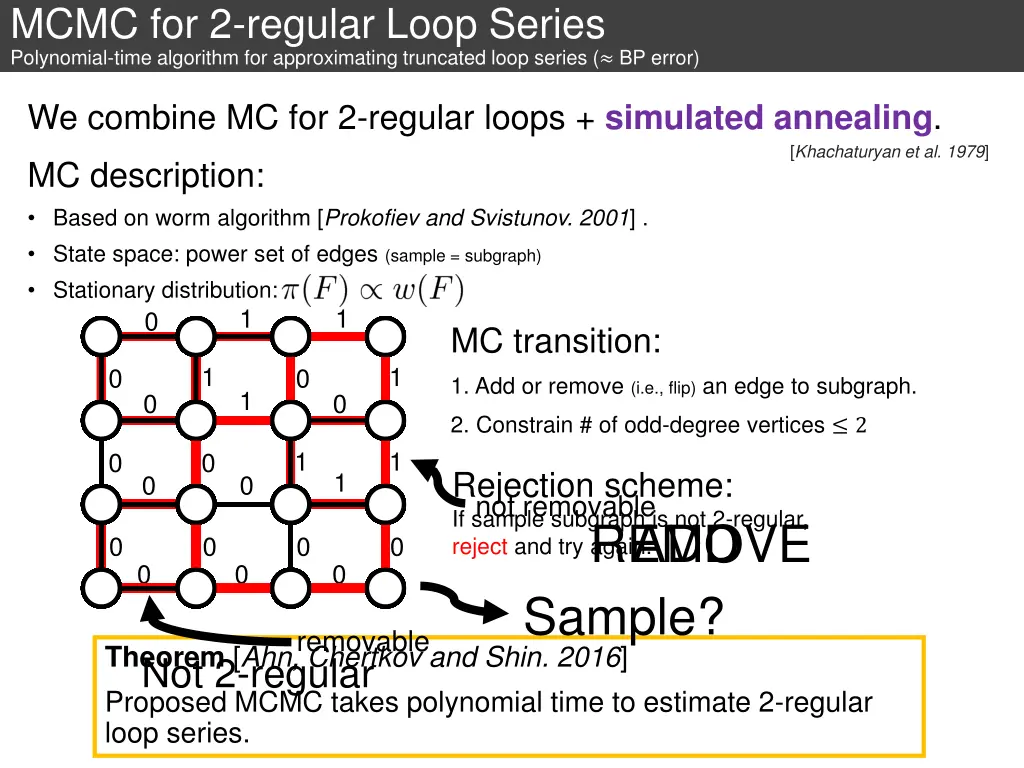
MCMC for 2-regular Loop Series Polynomial-time algorithm for approximating truncated loop series (≈ BP error) We combine MC for 2-regular loops + simulated annealing. [Khachaturyan et al. 1979] MC description: • Based on worm algorithm [Prokofiev and Svistunov. 2001] . • State space: power set of edges (sample = subgraph) • Stationary distribution: 1 1 0 MC transition: 1 1 0 0 1. Add or remove (i.e., flip) an edge to subgraph. 1 0 0 2. Constrain # of odd-degree vertices ≤ 2 1 1 0 0 Rejection scheme: If sample subgraph is not 2-regular, reject and try again. ADD REMOVE Sample? 1 0 0 not removable 0 0 0 0 0 0 0 removable Theorem [Ahn, Chertkov and Shin. 2016] Proposed MCMC takes polynomial time to estimate 2-regular loop series. Not 2-regular
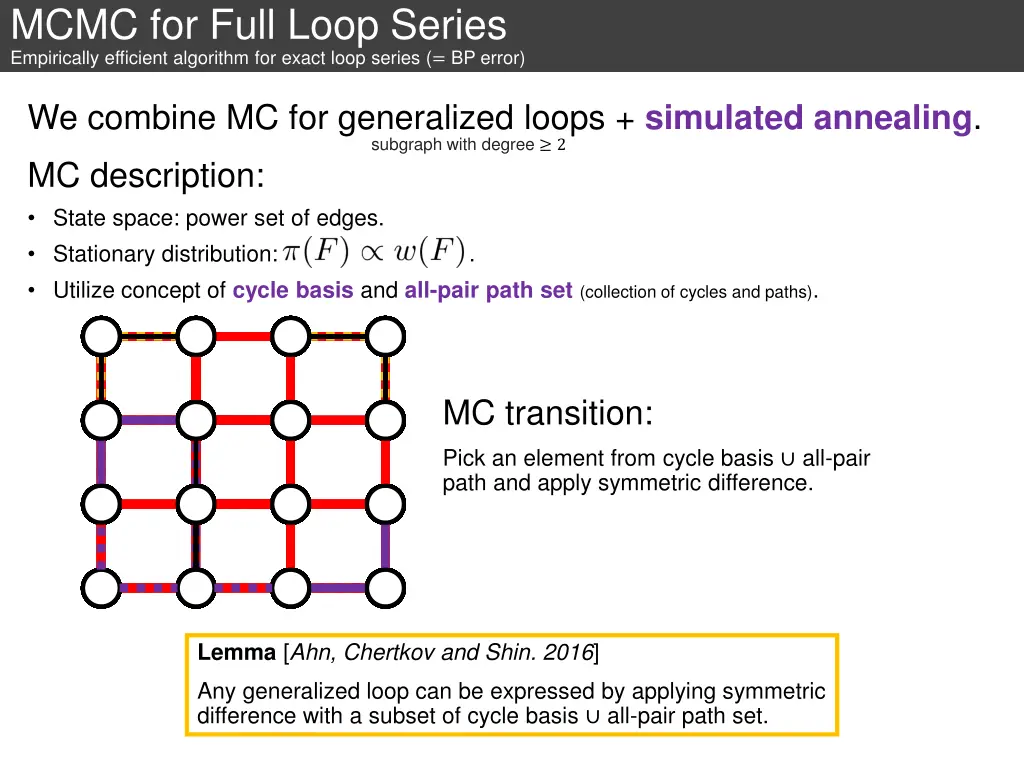
MCMC for Full Loop Series Empirically efficient algorithm for exact loop series (= BP error) We combine MC for generalized loops + simulated annealing. subgraph with degree ≥ 2 MC description: • State space: power set of edges. • Stationary distribution: • Utilize concept of cycle basis and all-pair path set (collection of cycles and paths). . Cycle basis: Minimal set of cycles, expressing every Eulerian subgraph by symmetric difference All-pair path set: Set of paths, having a path for every possible combination of endpoints Lemma [Ahn, Chertkov and Shin. 2016] Any generalized loop can be expressed by applying symmetric difference with a subset of cycle basis ∪ all-pair path set.
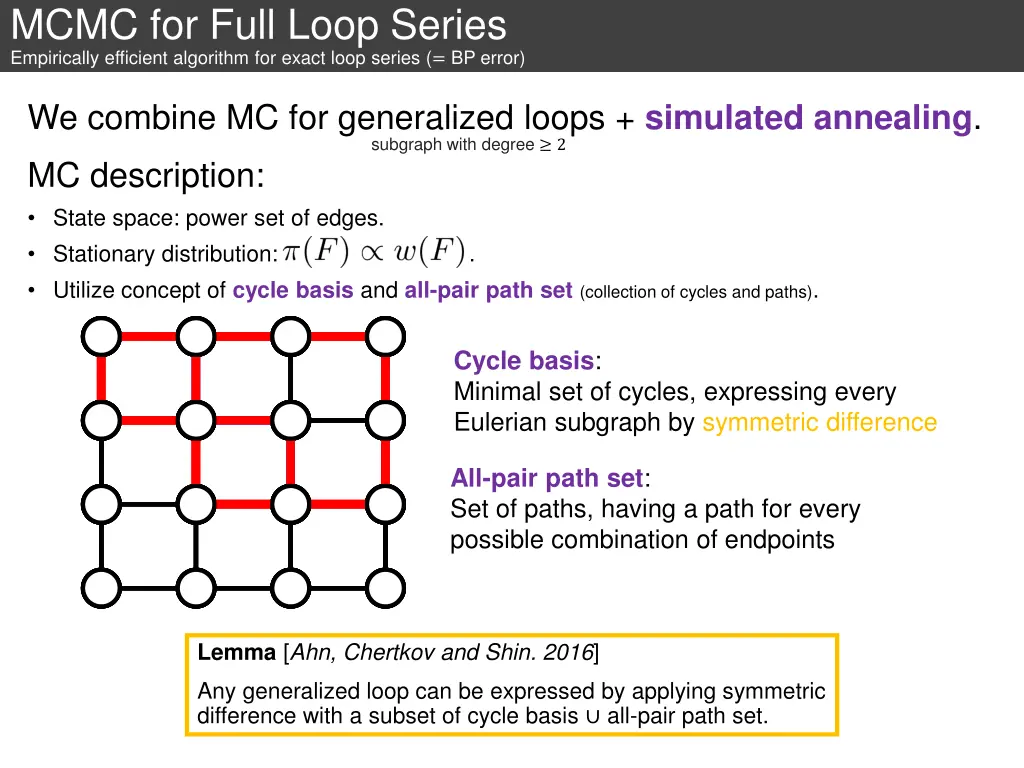
MCMC for Full Loop Series Empirically efficient algorithm for exact loop series (= BP error) We combine MC for generalized loops + simulated annealing. subgraph with degree ≥ 2 MC description: • State space: power set of edges. • Stationary distribution: . • Utilize concept of cycle basis and all-pair path set (collection of cycles and paths). MC transition: Pick an element from cycle basis ∪ all-pair path and apply symmetric difference. Lemma [Ahn, Chertkov and Shin. 2016] Any generalized loop can be expressed by applying symmetric difference with a subset of cycle basis ∪ all-pair path set.
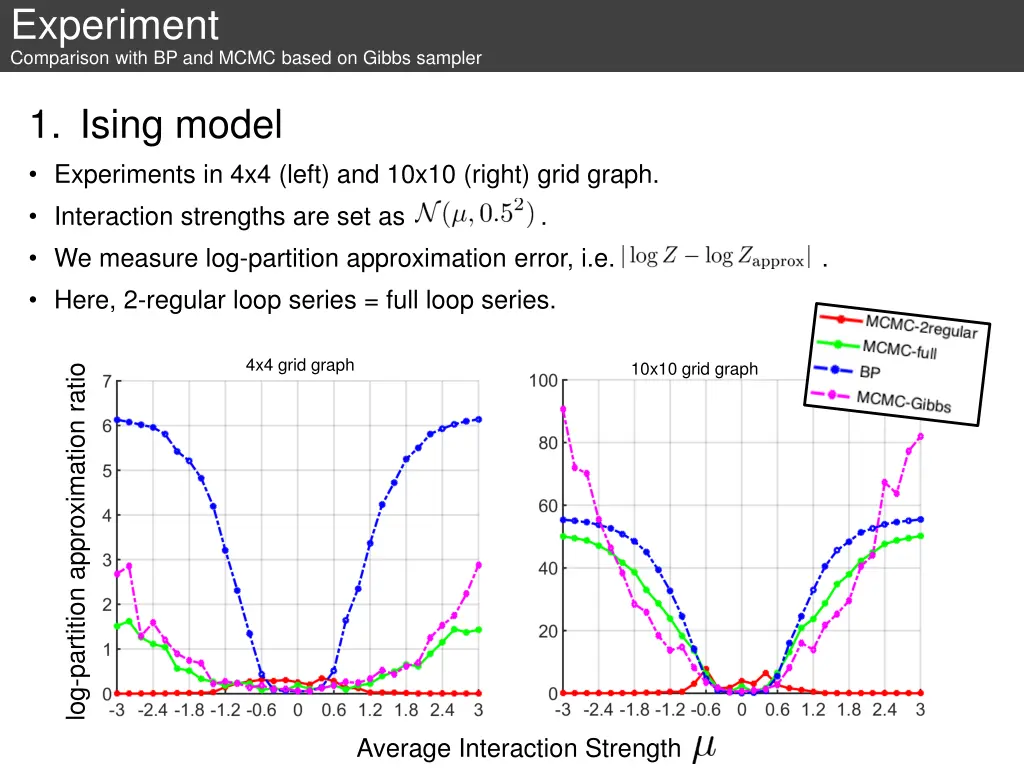
Experiment Comparison with BP and MCMC based on Gibbs sampler 1. Ising model • Experiments in 4x4 (left) and 10x10 (right) grid graph. • Interaction strengths are set as • We measure log-partition approximation error, i.e. . • Here, 2-regular loop series = full loop series. . 4x4 grid graph 10x10 grid graph log-partition approximation ratio Average Interaction Strength
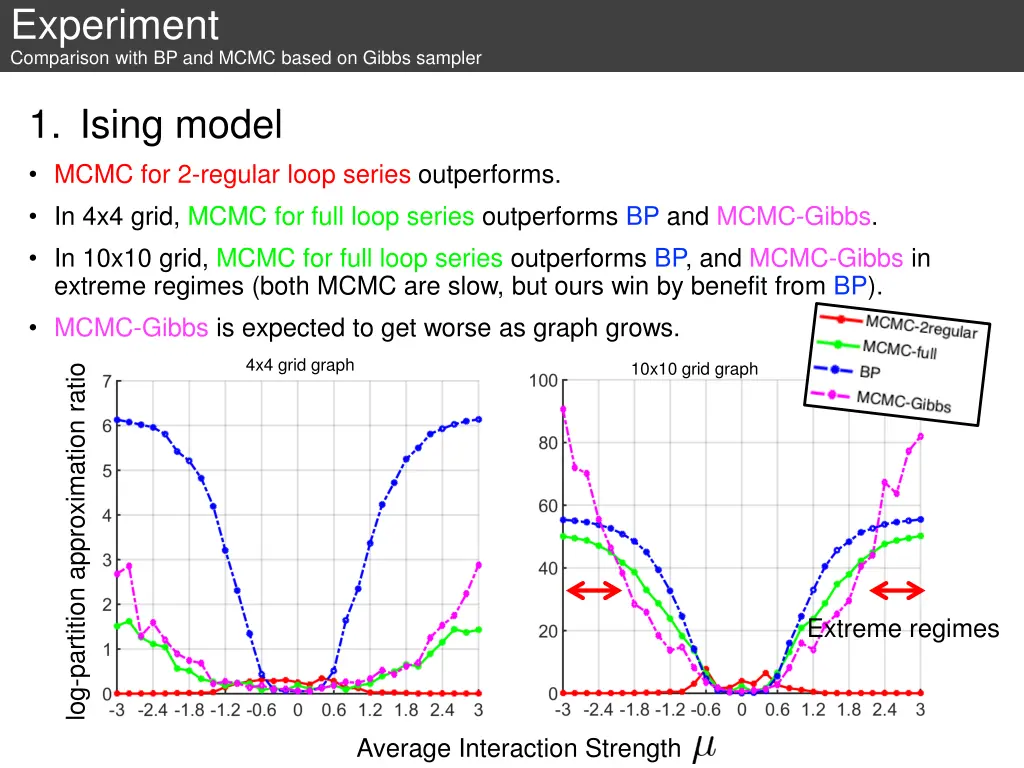
Experiment Comparison with BP and MCMC based on Gibbs sampler 1. Ising model • MCMC for 2-regular loop series outperforms. • In 4x4 grid, MCMC for full loop series outperforms BP and MCMC-Gibbs. • In 10x10 grid, MCMC for full loop series outperforms BP, and MCMC-Gibbs in extreme regimes (both MCMC are slow, but ours win by benefit from BP). • MCMC-Gibbs is expected to get worse as graph grows. 4x4 grid graph 10x10 grid graph log-partition approximation ratio Extreme regimes Average Interaction Strength
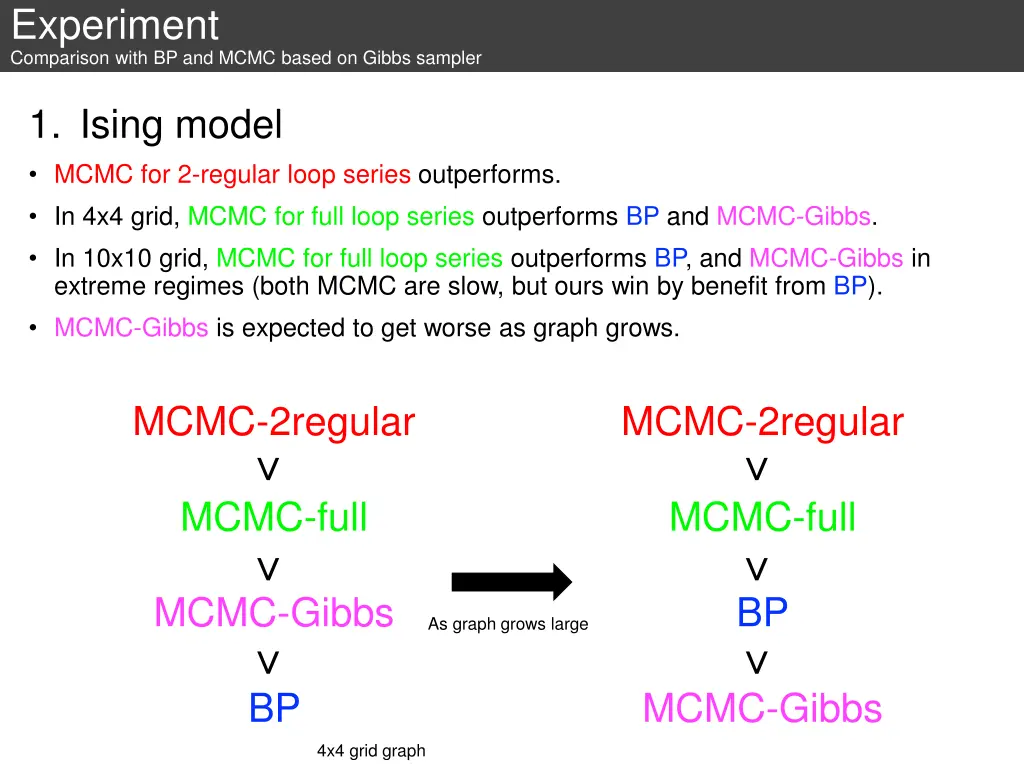
Experiment Comparison with BP and MCMC based on Gibbs sampler 1. Ising model • MCMC for 2-regular loop series outperforms. • In 4x4 grid, MCMC for full loop series outperforms BP and MCMC-Gibbs. • In 10x10 grid, MCMC for full loop series outperforms BP, and MCMC-Gibbs in extreme regimes (both MCMC are slow, but ours win by benefit from BP). • MCMC-Gibbs is expected to get worse as graph grows. MCMC-2regular > MCMC-2regular > MCMC-full > MCMC-full > MCMC-Gibbs > BP > As graph grows large BP MCMC-Gibbs 4x4 grid graph
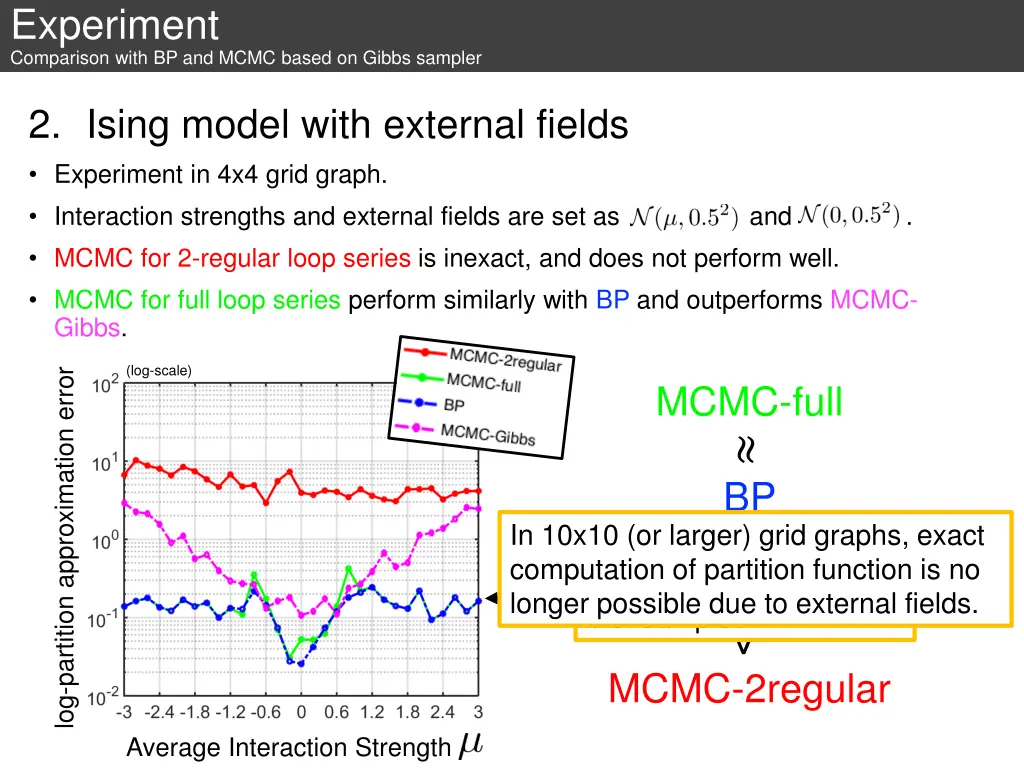
Experiment Comparison with BP and MCMC based on Gibbs sampler 2. Ising model with external fields • Experiment in 4x4 grid graph. • Interaction strengths and external fields are set as • MCMC for 2-regular loop series is inexact, and does not perform well. • MCMC for full loop series perform similarly with BP and outperforms MCMC- Gibbs. and . (log-scale) log-partition approximation error MCMC-full ≈ BP > In 10x10 (or larger) grid graphs, exact computation of partition function is no longer possible due to external fields. BP error is too small to be estimated with small # of samples. MCMC-Gibbs > MCMC-2regular Average Interaction Strength
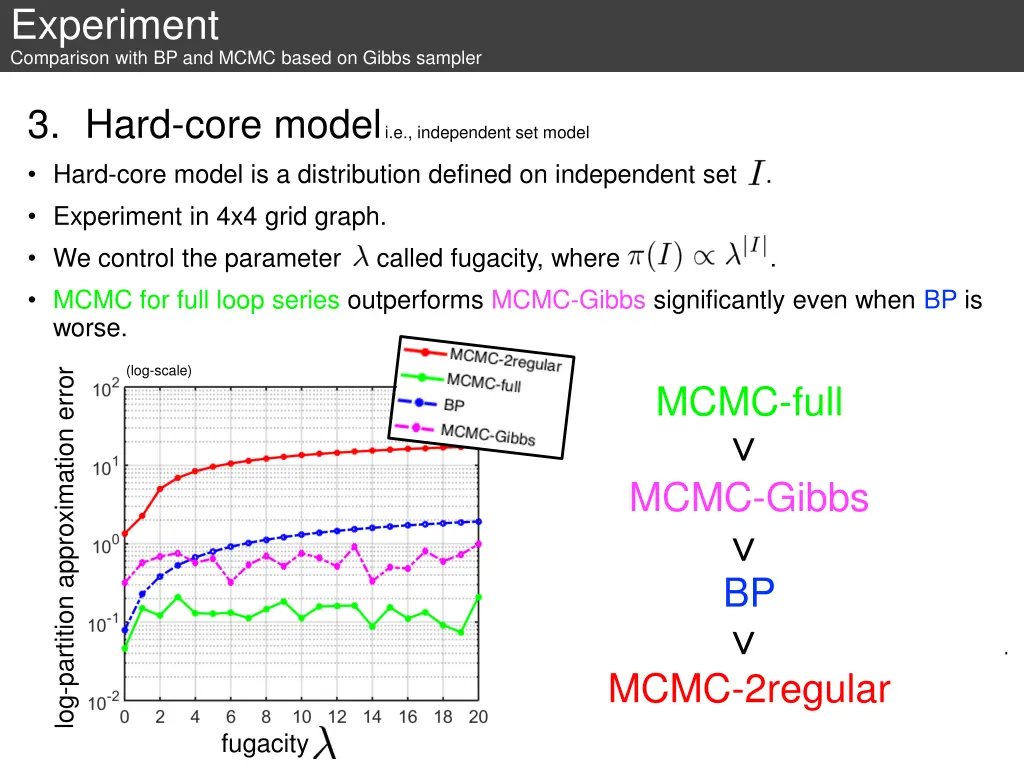
Experiment Comparison with BP and MCMC based on Gibbs sampler 3. Hard-core model • Hard-core model is a distribution defined on independent set . • Experiment in 4x4 grid graph. • We control the parameter called fugacity, where . • MCMC for full loop series outperforms MCMC-Gibbs significantly even when BP is worse. i.e., independent set model (log-scale) log-partition approximation error MCMC-full > MCMC-Gibbs > BP > In an independent set, no vertices are adjacent. MCMC-2regular fugacity
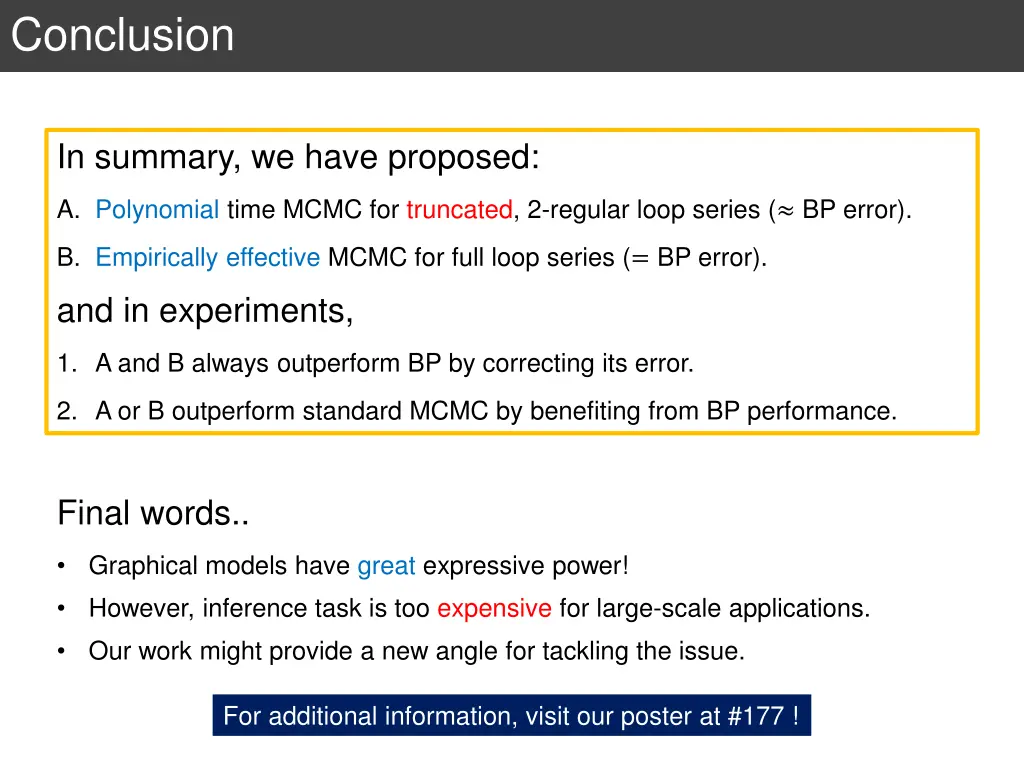
Conclusion In summary, we have proposed: A. Polynomial time MCMC for truncated, 2-regular loop series (≈ BP error). B. Empirically effective MCMC for full loop series (= BP error). and in experiments, 1. A and B always outperform BP by correcting its error. 2. A or B outperform standard MCMC by benefiting from BP performance. Final words.. Graphical models have great expressive power! However, inference task is too expensive for large-scale applications. Our work might provide a new angle for tackling the issue. • • • For additional information, visit our poster at #177 !