Dylan Millet Harvard University with
150 likes | 320 Vues
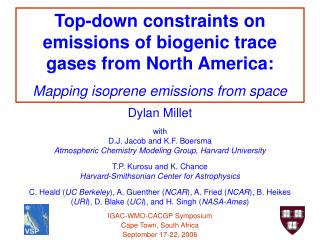
NOAA C&GC Postdoctoral Fellowship Program. NASA Atmospheric Chemistry Program. New Constraints on Terrestrial and Oceanic Sources of Atmospheric Methanol. Dylan Millet Harvard University with D. Jacob (Harvard), D. Blake (UCI), T. Custer and J. Williams (MPI),

Dylan Millet Harvard University with
E N D
Presentation Transcript
NOAA C&GC Postdoctoral Fellowship Program NASA Atmospheric Chemistry Program New Constraints on Terrestrial and Oceanic Sources of Atmospheric Methanol Dylan Millet Harvard University with D. Jacob (Harvard), D. Blake (UCI), T. Custer and J. Williams (MPI), J. de Gouw, C. Warneke, and J. Holloway (NOAA), T. Karl (NCAR), H. Singh (NASA), B. Sive (UNH) Thanks to: American Geophysical Union Fall Meeting 2007
Methanol: The Most Abundant Non-Methane Organic Gas Oxidation by OH Atmospheric Production Source of CO, HCHO, O3 Sink of OH CH3OH Burden: ~4 Tg Lifetime: 5-10 d CH4 Wet Dep Ocean Exchange Dry Dep (Land) Plant Growth Plant Decay Biomass Burning Urban Emissions ?
Aircraft and Surface Measurements Used to Constrain Methanol Sources & Sinks Interpret with: GEOS-Chem 3D model of atmospheric chemistry GEOS-Chem 3D model of atmospheric chemistry New plot with all obs SURFACE OOMPH, NEAQS-2K2, Kinterbish, Tennessee, UMBS, Trinidad Head, Duke Forest, Chebogue Pt, Appledore Isl., Thompson Farm, Rondônia, Amazonas AIRCRAFT PEM-TB, INTEX-A/B, MILAGRO, ITCT-2K2/2K4, TOPSE, LBA/CLAIRE, TROFFEE, TEXAQS-II
Methanol: The Most Abundant Non-Methane Organic Gas Oxidation by OH Atmospheric Production CH3OH Burden: ~4 Tg Lifetime: 5-10 d Source of CO, HCHO, O3 CH4 Wet Dep Ocean Exchange Dry Dep (Land) Plant Growth Plant Decay Biomass Burning Urban Emissions
Ocean Mixed Layer (OML): Source + Sink for Atmospheric Methanol Previous work: • · Assume constant OML undersaturation · OML a small net sink • Assumes air-sea exchange controls [CH3OH]OML
Ocean Mixed Layer (OML): Source + Sink for Atmospheric Methanol Recent OML Measurements imply a large methanol reservoir (20× that of the atmosphere) Short lifetime requires large OML source (~8E3 Tg/y) CH3OH 120 ± 50 nM [Williams et al., 2004] 66 Tg Biotic consumption ~ 3 d [Heikes et al., 2002]
Ocean Mixed Layer (OML): Source + Sink for Atmospheric Methanol Recent OML Measurements imply a large methanol reservoir (20× that of the atmosphere) OML ventilation weeks-months 100 Tg/y • Short lifetime requires large OML source (~8E3 Tg/y) • Transfer from atmosphere insufficient to balance loss • Large in-situ biological source implied CH3OH 120 ± 50 nM [Williams et al., 2004] 66 Tg Biotic consumption ~ 3 d [Heikes et al., 2002] Biological production
Ocean Mixed Layer (OML): Source + Sink for Atmospheric Methanol Recent OML Measurements imply a large methanol reservoir (20× that of the atmosphere) OML ventilation weeks-months 100 Tg/y • Short lifetime requires large OML source (~8E3 Tg/y) • Transfer from atmosphere insufficient to balance loss • Large in-situ biological source implied • Ocean emission, uptake: independent terms in atmospheric budget CH3OH 120 ± 50 nM [Williams et al., 2004] 66 Tg Biotic consumption ~ 3 d [Heikes et al., 2002] Biological production
Ocean Emission and Uptake of Atmospheric Methanol Calculate ocean source & sink terms independently · On basis of measured OML concentrations Ocean Emission Ocean Uptake =11 d 100 Tg y-1 85 Tg y-1 Marine biosphere: large source of atmospheric methanol Comparable to terrestrial biota Comparable to oxidation by OH Net Flux
New Air-Sea Flux Parameterization Generally Consistent with Atmospheric Observations Measured vs. modeled methanol concentrations over the S. Atlantic OOMPH 2007 Methanol profiles over the Pacific Measured Modeled
Methanol Emissions from the Terrestrial Biosphere All plants make methanol · Produced during cell growth · Emitted from leaves ~ f(T, hν) · E = 0.11% × NPP [Galbally & Kirstine, 2002] Aircraft Measurements Reveal Overestimate of Plant Growth Source Vertical Profiles over N. America Simulated summer methanol concentrations in surface air [ppb] Broad-scale inflow to W. US well simulated Measured Modeled • 2× BL overestimate during summer Only explained by overestimate of plant growth source
Bias Correlates Spatially with Regions of High Broadleaf Tree & Crop Coverage Modeled - Measured Modeled Observed Boundary Layer Methanol Concentrations [ppb] • Removal of bias requires: • 4x reduction of broadleaf tree + crop emissions, or • 2x reduction of emissions from all terrestrial plants MDVD2 vegetation coverage[Guenther et al., 2006]
Reduced Biogenic Source Yields Better Agreement over North America and Tropical South America Vertical Profiles over N. America Amazon Boundary Layer Measured Base case 2× (all plants) 4× (bdlf trees + crops) • Both optimizations of comparable quality • Best estimate of global terrestrial biogenic source: 80 Tg/y (vs. 145 Tg/y base case) • 2× all plants • 4× bdlf trees, crops Base case Measured
Importance of Biogenic vs. Anthropogenic Sources Methanol strongly correlated with CO despite lack of large anthro. source Aircraft measurements over N. America during summer Model captures correlation, slope (with independent constraints on CO) Measured Base case 2× (all plants) 4× (bdlf trees + crops)
Updated Global Budget of Atmospheric Methanol Sources Sinks 80 Tg/y 88 Tg/y 85 Tg/y 101 Tg/y 37 Tg/y 23 Tg/y 40 Tg/y 13 Tg/y Atmospheric lifetime: 4.7 days 12 Tg/y 5 Tg/y 108 molec/cm2/s 108 molec/cm2/s