Download
1 / 5
50 likes | 162 Vues
Explore the proportional contributions of different prey items to the diets of Chinook salmon and stickleback fish using the Index of Relative Importance (IRI) method. Analyze variations in prey consumption by size, site, and time. Study feeding behavior through fullness index and diel sampling.

E N D
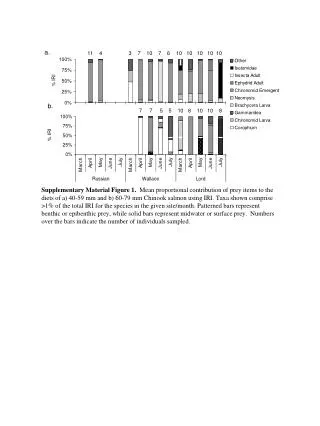
11 4 3 7 10 7 6 10 10 10 10 10 a. b. 7 7 5 5 10 8 10 10 8 Supplementary Material Figure 1. Mean proportional contribution of prey items to the diets of a) 40-59 mm and b) 60-79 mm Chinook salmon using IRI. Taxa shown comprise >1% of the total IRI for the species in the given site/month.Patterned bars represent benthic or epibenthic prey, while solid bars represent midwater or surface prey. Numbers over the bars indicate the number of individuals sampled.
a. 5 10 7 8 8 7 10 9 9 10 10 10 b. 10 10 8 8 8 10 10 10 10 10 10 10 10 10 10 c. 9 8 10 10 10 10 8 10 10 8 Supplementary Material Figure 2.Mean proportional IRI composition of a) 20-39 mm, b) 40-59 mm, and c) 60-79 mm stickleback diets by site and month. Patterned bars represent benthic or epibenthic prey, while solid bars represent midwater or surface prey.Taxa shown comprise >5% of the total IRI for the species in the given site/month. Blank columns indicate that fewer than 3 fish were caught. Numbers over the bars indicate the number of individuals sampled.
% IRI Chinook at Lord 4 4 4 10 12 9 6 9 3 % IRI Stickleback at Lord 10 10 10 10 10 10 10 14 10 % IRI Chinook at Russian 14 10 10 10 7 10 8 7 10 10 % IRI Stickleback at Russian 15 15 15 15 15 15 15 15 15 15 Time Supplementary Material Figure 3.Mean proportional contribution of prey items using IRI to the diets of Chinook salmon and stickleback at Lord and Russian over a 24 h period in April 2007. Numbers over the bars indicate number of individuals sampled. Differences in the numbers of individuals sampled are due to the presence or absence of different size classes of fish during the sampling period.
a. b. Supplementary Material Figure 4.Mean fullness index (FI) ± SE for a) Chinook salmon and b) stickleback across months and sites.
a. b. Supplementary Material Figure 5.Mean fullness index (FI) for Chinook and sticklebacks ± SE over diel sampling at a) Russian, b) Lord. Trend lines for FI are based on best-fit 4th order polynomial curves. Shaded areas represent the period of darkness.