Download
1 / 19
190 likes | 359 Vues
Mapping hydrogen isotope ratios of water vapor with satellite-based measurements. David Noone Dept. Atmospheric and Oceanic Sciences and Cooperative Institute for Research in Environmental Sciences University of Colorado, Boulder CO.

E N D
Mapping hydrogen isotope ratios of water vapor with satellite-based measurements David Noone Dept. Atmospheric and Oceanic Sciences and Cooperative Institute for Research in Environmental SciencesUniversity of Colorado, Boulder CO Also, John Worden (JPL), Kevin Bowman (JPL), Derek Brown (CU-Boulder)
Outline • Water isotopes from space • Troposphere hydrology(not stratosphere, not boundary layer, not precip) • Framework for mapping processes(class of diagrams - special case gives “Keeling” ) • Example mapping processes controlling humidity • Outlook for isotopes from space
HDO in stratosphere ??? MIPAS (limb viewing IR) on Envisat. Also H218O, H217O. ACE (Canadian) now also HDO. Tag mechanisms that put water into the stratosphere. Lowest values, 200 permil higher than that from Rayleigh. Suggests convection moves water past cold point. Payne, Noone, et al., QJRMS, 2007.
Fourier transform spectrometer • Thermal infra-red (650 – 3050 cm-1) • Individual lines resolved (0.06 cm-1) • Primary mission O3, CO, CH4 • Micro-window contains H2O, CO2, HDO and H218O lines. • Bayesian non-linear retrieval minimizes error in covariance HDO/H2O to precise isotope ratio ~10 km hoz. resolution, ~200 km sampling, ~ 1 d.o.f. in vertical Worden, Bowman, Noone, et al. (2006)
Retrieval algorithm y = Kx + e x the atmospheric state (H2O, HDO, temperature, …)y measured infrared spectrum (from TES)K a linear estimate of the “true” forward model y = F(x)e errors (instrument, measurement, representation, forward model) What is the most probable state (x) minimizes the mismatch between a modeled spectrum y and the measured spectrum, given all errors? • K from line-by-line radiative transfer code describes theoretical change in spectrum as a function of species abundance (“Jacobian”) • For HDO, a priori is tropical annual mean from iso-CAM3. Performed such that the information content of a posteriori is maximized. • Precision about 10 permil for HDO, possible 50 permil bias. • H218O also possible, but error presently about 30 permil! • H217O also possible, error unknown. Maybe better than H218O, but not nearly enough to get D17O
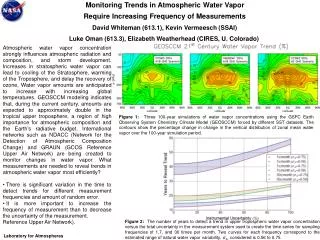
Annual mean dD from TES Layer average 825 to 500 hPa (max. sensitivity) Data most reliable between 30N and 30S. Noone et al., GEWEX, 2007
Want data? • HDO is now a standard TES product(note core mission is CO and O3) • All available in almost real time on NASA data server. Huge HDF files (500 mb/day/species) with many many error/diagnostic terms • Or, email me for processed files with dD data or maps with quality control. About 580000 numbers.
Dehydration Drying (mixing by eddies/weather) Isotopic depletion Isotopes conserved Dehydration Isotopic depletion Subtropical water source Debate in community – both impact climate change. Isotopes differentiate the effects of “dynamics” versus “microphysics” Emmanuel and Pierhumbert, 1999, Noone 2007
Distribution of relative humidity • Seasonal variations linked to atmospheric circulation(Monsoons in summer, dry subtropics in winter) • Clear regions where humidity is high (monsoonal continents, western Pacific), and where low (summertime subtropics) • Note, this is not a measure of how much water, but is a measure of what fraction of the holding capacity is realized. • Thus links atmospheric hydrology with thermodynamics
Humidity dependencies a) b) c) • RH = q/qs(T) • Everywhere RH lower when temperature higher • Everywhere RH higher when qHDO higher • i.e., proof that Clausius-Claperyon relation holds! • c) Isotopes thus signature of different processes leading to low/high RH in different locations.
What controls relative humidity? Annual mean: dD when RH is high minus dD when RH is low • Provides a measure of which processes are acting to control humidity variations • Mostly controlled by mixing with high latitude air in subtropics • Controlled by cloud processes in convective zones • Quantitative metrics? Noone, J. Climate (in prep)
Framework for mapping processes • Mass conservation (qi = Rq) S air mass mixing Special case of this general derivation gives “Keeling plot” Special case of evaporation Notice this is an exact integral form! No numerical method needed. Choice of isotope physics: P open (loss of water) P closed (reversible pseudoadiabatic)
Analysis of processes Mixing Closed Open • Particularly telltale signature of transport in JJA! • Super-Rayleigh distribution in convective regions • Ultimately regions linked by atmospheric transport (distributions over lap)
Conclusions • Mapping water isotopes (HDO) from space is viable to a precision that is of scientific use. • Provides a complimentary view to isotopes in precipitation. Also, complimentary to high precision in situ (or optical) vapor measurements. • Isotopes show tropical (and subtropical) atmospheric hydrology mostly associated with reversible physics! • HDO clearly differentiates (partitions) between locations where “source” dominates over sink. • First order: HDO tracks are mass motion (advective time scale shorter than source or sink) • Source and mixing more obvious, condensation and precipitation more difficult because of different ways it can occur. • It is a mistake to assume atmosphere is controlled by Rayleigh processes, an in fact, it is just plane wrong! Doing so belittles the information in isotopes.
Future? • Aura (on which TES sits) already over initial mission goal (2.5 years). • TES getting close to nominal engineering specifications (could fail any day, or could keep working fine for some years) • IASI (European MetOP satellite, core mission weather services) spectra has potential to be used for HDO (meets resolution requirements and needed part of IR spectrum). Core mission is weather services. Similarly, GoSAT Japan, launch late 2008. • NASA? The Decadal Survey is grim – no planned missions in next 10-20 years can do this. • May be opportunities to launch “explorer class” spacecraft, but will need strong community support. (~$100-300M versus Aura $1B+) • Ideally, have information in boundary layer, also H218O (for dxs), higher quality observations at mid-latitudes and poles. • This is doable, if instrument specs/sampling designed for it.
Postdoc opportunity • Working with TES HDO and isotopic CAM to identify water source regions via inversions • Contact David Noone (dcn@colorado.edu)
Explanation…(Conclusions part 1) • Case 1: low humidity, higher dDe.g., Western pacific and monsoonal continents • Isotopes can be explained by condensation causing the dehydration along with warming during rain formationConvection puts “fresh” isotopes and new water in the atmosphere • Case 2: high humidity, higher dDe.g., Eastern pacific and subtropics • Isotopes better explained by mixing with dry (and depleted) air from higher latitudes, and some degree of subsidence. • Rain/snow in midlatitudes depletes isotopes, thus giving low values • Tropical atmosphere most well described by reversible physics Note: Subsidence is along potential temperature surfaces, so causes warming, and thus lower relative humidity. Isotopes can not simply partition subsidence and large scale mixing from high latitudes, because d of source not known and likely the same.
The water cycle Vapour in equilibrium with ocean water Evaporation(“mixing”) Rayleigh condensation Mean ~ -225 permil Controlled by balance of condensation and boundary layer supply of oceanic water Fractionation efficiency a ~ 1.1