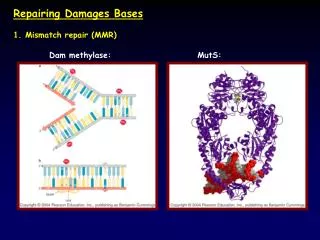
Data Repairing
Data Repairing. Giorgos Flouris, FORTH December 11-12, 2012, Luxembourg. PART I: Problem Statement and Proposed Solution (D2.2). Validity as a Quality Indicator. Validity is an important quality indicator Encodes context- or application-specific requirements


Data Repairing
E N D
Presentation Transcript
Data Repairing Giorgos Flouris, FORTH December 11-12, 2012, Luxembourg
Validity as a Quality Indicator • Validity is an important quality indicator • Encodes context- or application-specific requirements • Applications may be useless over invalid data • Binary concept (valid/invalid) • Two steps to guarantee validity (repair process): • Identifying invalid ontologies (diagnosis) • Detecting invalidities in an automated manner • Subtask of Quality Assessment • Remove invalidities (repair) • Repairing invalidities in an automated manner • Subtask of Quality Enhancement
Diagnosis • Expressing validity using validity rules over an adequate relational schema • Examples: • Properties must have a unique domain • p Prop(p) a Dom(p,a) • p,a,b Dom(p,a) Dom(p,b) (a=b) • Correct classification in property instances • x,y,p,a P_Inst(x,y,p) Dom(p,a) C_Inst(x,a) • x,y,p,a P_Inst(x,y,p) Rng(p,a) C_Inst(y,a) • Diagnosis reduced to relational queries
geo:location SpatialThing Sensor Observation Schema Data Item1 ST1 Example Ontology O0 Class(Sensor), Class(SpatialThing), Class(Observation) Prop(geo:location) Dom(geo:location,Sensor) Rng(geo:location,SpatialThing) Inst(Item1), Inst(ST1) P_Inst(Item1,ST1,geo:location) C_Inst(Item1,Observation), C_Inst(ST1,SpatialThing) • Correct classification in property instances • x,y,p,a P_Inst(x,y,p) Dom(p,a) C_Inst(x,a) Item1 geo:location ST1 Sensor is the domain of geo:location Item1 is not a Sensor P_Inst(Item1,ST1,geo:location)O0 Dom(geo:location,Sensor)O0 C_Inst(Item1,Sensor)O0 • Remove P_Inst(Item1,ST1,geo:location) • Remove Dom(geo:location,Sensor) • Add C_Inst(Item1,Sensor)
Preferences for Repair • Which repairing option is best? • Ontology engineer determines that via preferences • Specified by ontology engineer beforehand • High-level “specifications” for the ideal repair • Serve as “instructions” to determine the preferred (optimal) solution
O1 O0 O2 O3 Preferences (On Ontologies) Score: 3 Score: 4 Score: 6
O1 O0 O2 O3 Preferences (On Deltas) -P_Inst (Item1,ST1, geo:location) Score: 2 -Dom (geo:location,Sensor) Score: 4 +C_Inst (Item1,Sensor) Score: 5
Preferences • Preferences on ontologies are result-oriented • Consider the quality of the repair result • Ignore the impact of repair • Popular options: prefer newest/trustable information, prefer a specific ontological structure • Preferences on deltas are impact-oriented • Consider the impact of repair • Ignore the quality of the repair result • Popular options: minimize schema changes, minimize addition/deletion of information, minimize delta size • Properties of preferences • Preferences on ontologies/deltas are equivalent • Quality metrics can be used for stating preferences • Metadata on the data can be used (e.g., provenance) • Can be qualitative or quantitative
Generalizing the Approach • For one violated constraint • Diagnose invalidity • Determine minimal ways to resolve it • Determine and return preferred (optimal) resolution • For many violated constraints • Problem becomes more complicated • More than one resolution steps are required • Issues: • Resolution order • When and how to filter non-optimal solutions? • Constraint (and resolution) interdependencies
Constraint Interdependencies • A given resolution may: • Cause other violations (bad) • Resolve other violations (good) • Optimal resolution unknown ‘a priori’ • Cannot predict a resolution’s ramifications • Exhaustive, recursive search required (resolution tree) • Two ways to create the resolution tree • Globally-optimal (GO) / locally-optimal (LO) • When and how to filter non-optimal solutions?
Resolution Tree Creation (GO) • Find all minimal resolutions for all the violated constraints, then find the optimal ones • Globally-optimal (GO) • Find all minimal resolutions for one violation • Explore them all • Repeat recursively until valid • Return the optimal leaves Optimal repairs (returned)
Resolution Tree Creation (LO) • Find the minimal and optimal resolutions for one violated constraint, then repeat for the next • Locally-optimal (LO) • Find all minimal resolutions for one violation • Explore the optimal one(s) • Repeat recursively until valid • Return all remaining leaves Optimal repair (returned)
Characteristicsof GO Exhaustive Less efficient: large resolution trees Always returns optimal repairs Insensitive to constraint syntax Does not depend on resolution order Characteristicsof LO Greedy More efficient: small resolution trees Does not always return optimal repairs Sensitive to constraint syntax Depends on resolution order Comparison (GO versus LO)
PART II: Complexity Analysis andPerformance Evaluation(D2.2)
Algorithm and Complexity • Detailed complexity analysis for GO/LO and various different types of constraints and preferences • Inherently difficult problem • Exponential complexity (in general) • Exception: LO is polynomial (in special cases) • Theoretical complexity is misleading as to the actual performance of the algorithms
Performance in Practice • Performance in practice • Linear with respect to ontology size • Linear with respect to tree size • Types of violated constraints (tree width) • Number of violations (tree height) – causes the exponential blowup • Constraint interdependencies (tree height) • Preference (for LO): affects pruning (tree width) • Further performance improvement • Use optimizations • Use LO with restrictive preference
Evaluation Parameters • Evaluation • Effect of ontology size (for GO/LO) • Effect of tree size (for GO/LO) • Effect of violations (for GO/LO) • Effect of preference (relevant for LO only) • Quality of LO repairs • Evaluation results support our claims: • Linear with respect to ontology size • Linear with respect to tree size
Effect of Ontology Size 20000 (logscale) (logscale)
Effect of Tree Size (1/2) Nodes (x106)
Quality of LO Repairs (1/2) CCD KB Max( )
Quality of LO Repairs (2/2) CCD KB Min( )
Objectives and Main Idea • Evaluate repairing method in a real LOD setting • Using resources from WP4 • Using provenance-related preferences • Validate the utility of WP4 resources for a data quality benchmark • Evaluate the usefulness of provenance, recency etc as metrics/preferences for quality assessment and repair
Setting User seeks information on Brazilian cities Fuses Wikipedia dumps from different languages Guarantees maximal coverage, but may lead to conflicts E.g., city with two different population counts ES FR EN GE PT
Main Tasks Assess the quality of the resulting dataset Quality assessment framework Repair the resulting dataset Using the aforementioned repairing method Evaluate the use of provenance-related preferences Prefer most recent information Prefer most trustworthy information
Contributions • Contributions: • Define 5 different metrics based on provenance • Each metric is used as: • Quality assessment metric (to assess quality) • Repairing preference (to “guide” the repair) • Evaluate them in a real setting
Experiments (Setting) Setting Fused 5 Wikipedias: EN, PT, SP, GE, FR Distilled information about Brazilian cities Properties considered: populationTotal areaTotal foundingDate Validity rules: properties must be functional Repaired invalidities (using our metrics) Checked quality of result Dimensions: consistency, validity, conciseness, completeness and accuracy
Metrics for Experiments (1/2) PREFER_PT: select conflicting information based on its source (PT>EN>SP>GE>FR) PREFER_RECENT: select conflicting information based on its recency (most recent is preferred) PLAUSIBLE_PT: ignore “irrational” data (population<500, area<300km2, founding date<1500AD) otherwise use PREFER_PT
Metrics for Experiments (2/2) WEIGHTED_RECENT: select based on recency, but in cases where the records are almost equally recent, use source reputation (if less than 3 months apart, use PREFER_PT, else use PREFER_RECENT) CONDITIONAL_PT: define source trustworthiness depending on data values (prefer PT for small cities with population<500.000, prefer EN for the rest)
Consistency, Validity Consistency Lack of conflicting triples Guaranteed to be perfect (by the repairing algorithm), regardless of preference Validity Lack of rule violations Coincides with consistency for this example Guaranteed to be perfect (by the repairing algorithm), regardless of preference
Conciseness, Completeness Conciseness No duplicates in the final result Guaranteed to be perfect (by the fuse process), regardless of preference Completeness Coverage of information Improved by fusion Unaffected by our algorithm Input completeness = output completeness, regardless of preference Measured to be at 77,02%
Accuracy Most important metric for this experiment Accuracy Closeness to the “actual state of affairs” Affected by the repairing choices Compared repair with the Gold Standard Taken from an official and independent data source (IBGE)
Accuracy Evaluation … fr.dbpedia en.dbpedia pt.dbpedia Instituto Brasileiro de Geografia e Estatística(IBGE) Fuse/Repair dbpedia:areaTotal dbpedia:populationTotal dbpedia:foundingDate dbpedia:areaTotal dbpedia:populationTotal dbpedia:foundingDate Gold Standard integrated data Compare Accuracy
Accuracy Examples City of Aracati Population: 69159/69616 (conflicting) Record in Gold Standard: 69159 Good choice: 69159 Bad choice: 69616 City of Oiapoque Population: 20226/20426 (conflicting) Record in Gold Standard: 20509 Optimal approximation choice: 20426 Sub-optimal approximation choice: 20226
Publications • Yannis Roussakis, Giorgos Flouris, Vassilis Christophides. Declarative Repairing Policies for Curated KBs. In Proceedings of the 10th Hellenic Data Management Symposium (HDMS-11), 2011. • Giorgos Flouris, Yannis Roussakis, Maria Poveda-Villalon, Pablo N. Mendes, Irini Fundulaki. Using Provenance for Quality Assessment and Repair in Linked Open Data. In Proceedings of the Joint Workshop on Knowledge Evolution and Ontology Dynamics (EvoDyn-12), 2012. • Yannis Roussakis, Giorgos Flouris, Vassilis Christophides. Preference-Based Repairing of RDF(S) DBs. Under review in TODS Journal.
Repair • Removing invalidities by changing the ontology in an adequate manner • General concerns: • Return a valid ontology • Strict requirement • Minimize the impact of repair upon the data • Make minor, targeted modifications that repair the ontology without changing it too much • Return a “good” repair • Emulate the changes that the ontology engineer would do for repairing the ontology
Inference • Inference expressed using validity rules • Example: • Transitivity of class subsumption • a,b,c C_Sub(a,b) C_Sub(b,c) C_Sub(a,c) • In practice we use labeling algorithms • Avoid explicitly storing the inferred knowledge • Improve efficiency of reasoning
Quality Assessment Quality = “fitness for use” Multi-dimensional, multi-faceted, context-dependent Methodology for quality assessment Dimensions Aspects of quality Accuracy, completeness, timeliness, … Indicators Metadata values for measuring dimensions Last modification date (related to timeliness) Scoring Functions Functions to quantify quality indicators Days since last modification date Metrics Measures of dimensions (result of scoring function) Can be combined