Download
1 / 16
160 likes | 260 Vues
This document summarizes the findings on agricultural water use in the Colorado River Basin, presented during the March 23, 2009, meeting by regional specialists Denis Reich and Rod Sharp from CSU Extension. Key data reveal consumptive use in agriculture, highlighting 88% of the in-basin consumptive use with detailed statistics on irrigated acres and total consumptive use by water district as of 1990 and 2004. Relevant comparisons and economic impacts are discussed, emphasizing the need for sustainable practices in agriculture amidst changing water availability.

E N D
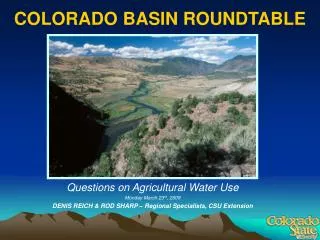
COLORADO BASIN ROUNDTABLE Questions on Agricultural Water Use Monday March 23rd, 2009 DENIS REICH & ROD SHARP – Regional Specialists, CSU Extension 1
Consumptive Use Fruit Salad SWSI I & II 2001, 2004 CWCB 1986-90 Uses and Losses Ag CU? USBR 1993 Irrigated Acres CDSS
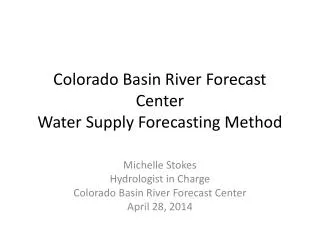
Colorado River Basin Consumptive Use by Use (1990*) 55 kAF Total: 951,600 AF Agricultural CU = 88% of in-basin CU 403* kAF 491 kAF CWCB, 1990 *no High Altitude coefficients Irrigated Acres* = 270,850
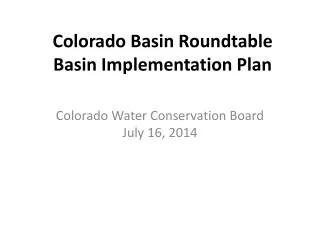
Total CU by Water District (1990) Total: 403,336 AF 50 51 53 52 39 Glenwood Springs 37 36 70 45 72 38 CWCB, 1990 Grand Junction
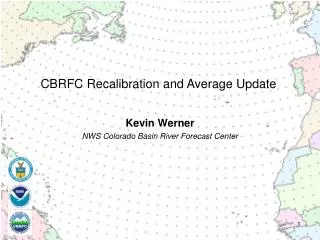
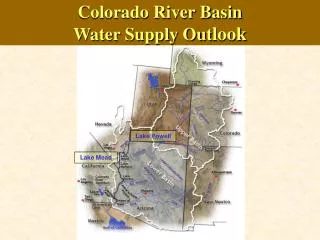
Colorado River Basin Areas affected by “high altitude” 6500 ft contour Glenwood Springs Grand Junction
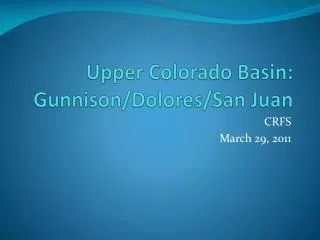
Total CU by Water District (1990) With 6500 ft contour 50 51 53 52 39 Glenwood Springs 37 36 70 45 72 38 CWCB, 1990 Grand Junction
Colorado River Basin Consumptive Use (CU) by Use (2004*) 74 kAF Total: 932,900* AF Agricultural CU = 83% of in-basin CU 367* kAF 491 kAF CWCB, 2004 *with 10% for High Altitude coefficients Irrigated Acres= 237,700 High Altitude Pasture* = 91,000
Summary *Includes High Altitude Pasture correction
Agricultural Facts • Number of Farms • Harvested Cropland • Irrigated Acres • Total Agricultural Sales • Crop Sales • Livestock Sales • Total Economic Impact of Agricultural • Agricultural Employment
Agriculture by County ROUTT GRANBY GARFIELD EAGLE VAIL DILLON SUMMIT GLENWOOD SPRINGS MESA BASALT PITKIN ASPEN GRAND JUNCTION GRAND Colorado River KREMMLING Eagle River EAGLE RIFLE Colorado River PALISADE
Summary Per Irrigated Acre Average (weighted by acres) = $361 *Average of 1.55 AF per irrigated acre per year
Questions? Rod Sharp: 245-9149, Rod.Sharp@Colostate.eduDenis Reich: 242-8683, Denis.Reich@Colostate.edu
Preserving Agriculture? $361 per AF versus….