Download
1 / 7
70 likes | 99 Vues
Airis Trainings is a best training center for Datascience given corporate trainings to different reputed companies. In Datascience training all sessions are teaching with examples and with real time scenarios. We are helping in real time how approach job market, Datascience Resume preparation, Datascience Interview point of preparation, how to solve problem in Datascience projects in job environment, information about job market etc. Training also providing classroom Training in Hyderabad and online from anywhere<br>Call Us on 91-9705299988<br>Email : info@airistrainings.com<br>

E N D
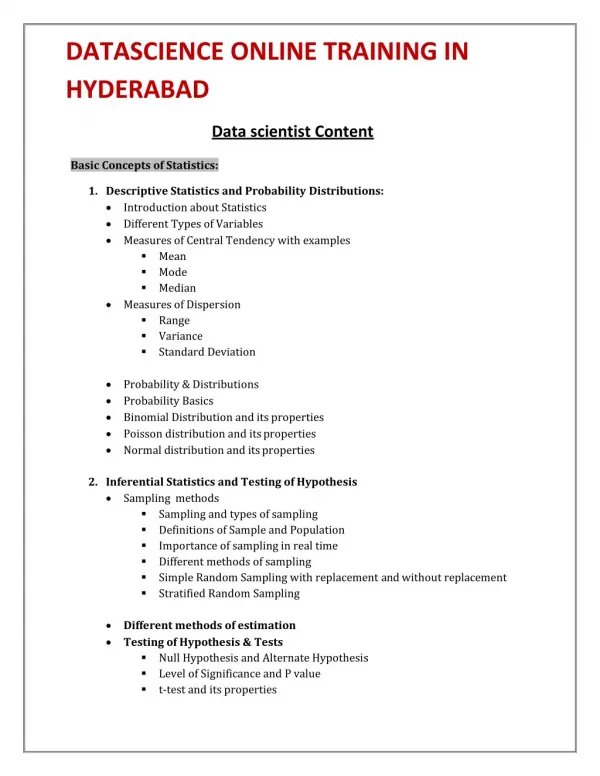
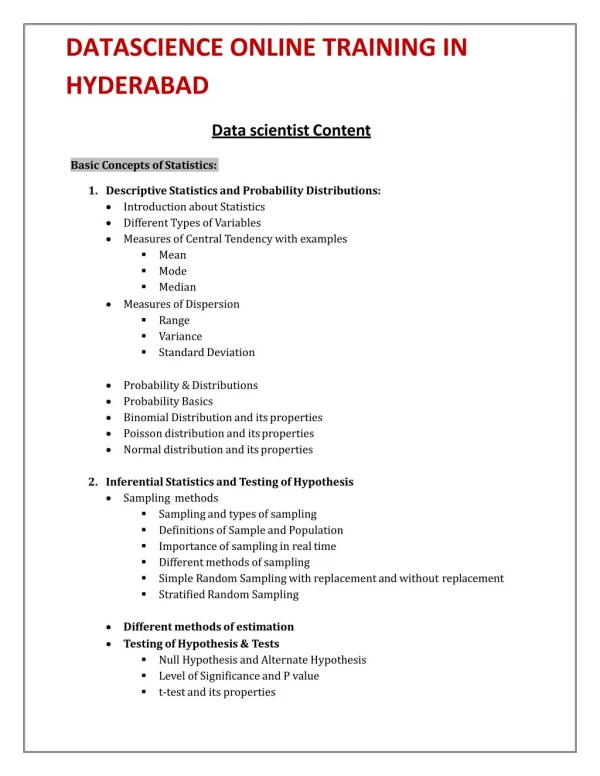
DATASCIENCE ONLINE TRAINING IN HYDERABAD Data scientistContent Basic Concepts ofStatistics: • Descriptive Statistics and ProbabilityDistributions: • Introduction aboutStatistics • Different Types ofVariables • Measures of Central Tendency with examples • Mean • Mode • Median • Measures ofDispersion • Range • Variance • StandardDeviation • Probability &Distributions • Probability Basics • Binomial Distribution and itsproperties • Poisson distribution and itsproperties • Normal distribution and itsproperties • Inferential Statistics and Testing ofHypothesis • Samplingmethods • Sampling and types ofsampling • Definitions of Sample andPopulation • Importance of sampling in realtime • Different methods ofsampling • Simple Random Sampling with replacement and withoutreplacement • Stratified RandomSampling • Different methods ofestimation • Testing of Hypothesis &Tests • Null Hypothesis and AlternateHypothesis • Level of Significance and Pvalue • t-test and itsproperties
Chi-square test and it’sproperties • Ztest • Analysis ofVariance • F-test • One and Two wayANOVA • Covariance &Correlation • Importance and Properties ofCorrelation • Types of Correlation withexamples Predictive Modeling Steps and Methodology with Liveexample: • DataPreparation • VariableSelection • Transformation of thevariables • Normalization of thevariables • Exploratory Dataanalysis • SummaryStatistics • Understanding the patterns of the data at single and multipledimensions • Missing data treatment using differentmethods • Outlier’s identification and treatingoutliers • Visualization of the data using the One Dimensional, Two Dimensional and Multi DimensionalGraphs. • Bar chart, Histogram, Box plot, Scatter plot, Bubble chart, Word cloudetc… • ModelDevelopment • Selection of the sampledata • Selecting the appropriate model based on the requirement and data availability • ModelValidation • ModelImplementation • Key Statistical parameterschecking • Validating the model results with the actualresult • ModelImplementation • Implementing the model for futureprediction • Real time telecom business use case with detailexplanation • Introducing couple of real time use cases and solutions of Banking and Retail domains using the different statisticalmethods. SupervisedTechniques:
Multiple linearRegression • Linear Regression - Introduction -Applications • Assumptions of LinearRegression • Building Linear RegressionModel • Understanding standard metrics (Variable significance, R-square/Adjusted R-Square, Global hypothesisetc) • Validation of Linear Regression Models (Re running Vs.Scoring) • Standard Business Outputs (Decile Analysis, Error distribution (histogram), Model equation, driversetc) • Interpretation of Results - Business Validation - Implementation on newdata • Real time case study of Manufacturing and Telecom Industry to estimate the future revenue using themodels • LogisticRegression • Logistic Regression - Introduction -Applications • Linear Regression Vs. Logistic Regression Vs. Generalized LinearModels • Building Logistic RegressionModel • Understanding standard model metrics (Concordance, Variablesignificance, Hosmer Lemeshov Test, Gini, KS, Misclassificationetc) • Validation of Logistic Regression Models (Re running Vs.Scoring) • Standard Business Outputs (Decile Analysis, ROCCurve) • Probability Cut-offs, Lift charts, Model equation, driversetc) • Interpretation of Results - Business Validation - Implementation on newdata • Real time case study to Predict the Churn customers in the Banking and Retailindustry • Partial Least SquareRegression • Partial Least square Regression - Introduction -Applications • Difference between Linear Regression and Partial Least SquareRegression • Building PLSModel • Understanding standard metrics (Variable significance, R-square/Adjusted R-Square, Global hypothesisetc) • Interpretation of Results - Business Validation - Implementation on newdata • Sharing the real time example to identify the key factors which are driving theRevenue Variable ReductionTechniques • FactorAnalysis • Principle componentanalysis • Assumptions ofPCA • Working Mechanism ofPCA
Types ofRotations • Standardization • Positives and Negatives ofPCA Supervised TechniquesClassification: • CHAID • CART • Difference between CHAID andCART • RandomForest • Decision tree vs. RandomForest • DataPreparation • Missing dataimputation • Outlierdetection • Handling imbalancedata • Random Recordselection • Random Forest Rparameters • Random Variableselection • Optimal number of variablesselection • Calculating Out Of Bag (OOB) errorrate • Calculating Out of BagPredictions • Couple of Real time use cases which are related to Telecom and Retail Industry. Identification of theChurn. UnsupervisedTechniques: • Segmentation for MarketingAnalysis • Need forsegmentation • Criterion ofsegmentation • Types ofdistances • Clusteringalgorithms • Hierarchicalclustering • K-meansclustering • Deciding number ofclusters • Casestudy • Business RulesCriteria • Real time use case to identify the Most Valuable revenue generatingCustomers. Time seriesAnalysis: • Forecasting - Introduction -Applications
Time Series Components( Trend, Seasonality, Cyclicity and Level) and Decomposition • Basic Techniques – • Averages, • Smootheningetc • AdvancedTechniques • ARModels, • ARIMA • UCM • HybridModel • Understanding Forecasting Accuracy - MAPE, MAD, MSEetc • Couple of use cases, To forecast the future sales ofproducts TextAnalytics: • Gathering text data from web and othersources • Processing raw webdata • Collecting twitter data with TwitterAPI • Naive BayesAlgorithm • Assumptions and of NaïveBayes • Processing of Textdata • Handling Standard and Textdata • Building Naïve BayesModel • Understanding standard modelmetrics • Validation of the Models (Re running Vs.Scoring) • Sentimentanalysis • GoalSetting • TextPreprocessing • Parsing thecontent • Text refinement • Analysis and Scoring • Use case of Health care industry, To identify the sentiment of the patients on Specified hospital by extracting the data from theTWITTER. Visualization UsingTableau: • Live connectivity from R toTableau • Generating the Reports andCharts
RPROGRAMMING SESSION 1: Getting Started withR What is statisticalprogramming? The Rpackage Installation ofR The R commandline Function calls, symbols, and assignment Packages Getting help onR Basic features ofR Calculating withR SESSION 2: Matrices, Array, Lists, and Data Frames Charactervectors Operations on the logicalvectors Creating the matrices and operations on it Creating the array and operations on it Creating the lists and operations on it Making dataframes Working with dataframes SESSION3: Getting Data in and out ofR Importing Data intoR Exporting Data inR Copy Data from Excel to R Loading and Saving Data withR Importing different types of fileformats SESSION4: Data Manipulation and Exploration: Variable transformations Creating Dummyvariables Data set options (Rename,Label) Keep / DropColumns Identification and Dealing with the Missing data Sorting thedata Handling theDuplicates Joining and Merging (Inner,Left,Right and Cross Join) Calculating DescriptiveStatistics Summarize numeric variables Summarize factor variables TransposeData Aggregated functions using Groupby dplyr anddatatable packages for the datamanipulation
Data preparation using the sqldfpackage • SESSION5: Conditional Statements andLoops: • IfElse • Nested IfElse For Loop WhileLoop • SESSION6:Functions: • CharacterFunctions NumericFunctions • Apply Function on Rows Converting a factor to integer Indexing Operators inList • SESSION7: Graphicalprocedures • Pie chart BarChart • Box plot Scatterplot • Multi Scatterplot • Word cloudetc.… • SESSION8: Advanced R and Real time analyticsexamples: • Data extraction from the Twitter Text Datahandling • Positive and Negative word cloud Required packages for theanalytics • Sentiment analysis using the real timeexample • R codeautomation • Time series analysis with the real time Telecom data Couple of examples with the time seriesdata • <a herf =” http://airistrainings.com/data-scienceonline-training-hyderbad.php”>Datascience online training inHyderabad</a> • <a href=” http://airistrainings.com/data-scienceonline-training-hyderbad.php”>Best datascienceonline training inHyderabad</a>