Unsupervised Detection of Anomalous Text
740 likes | 914 Vues
Unsupervised Detection of Anomalous Text. David Guthrie. The University of Sheffield. Textual Anomalies. Computers are routinely used to detect differences from what is normal or expected fraud network attacks Principal focus of this research is to similarly detect text that is irregular

Unsupervised Detection of Anomalous Text
E N D
Presentation Transcript
Unsupervised Detection of Anomalous Text David Guthrie The University of Sheffield
Textual Anomalies • Computers are routinely used to detect differences from what is normal or expected • fraud • network attacks • Principal focus of this research is to similarly detect text that is irregular • We view text that deviates from its context as a type of anomaly
Anomalous Documents? New Document Collection
Anomalous Documents? Find text that is unusual
New Document Anomalous Segments?
New Document Anomalous Segments?
New Document Anomalous Segments?
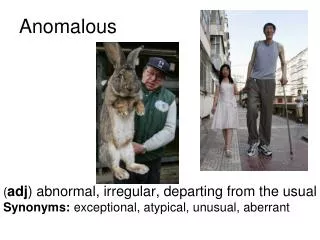
New Document Anomalous Segments? Anomalous
Motivation • Plagiarism • Writing style of plagiarized passages anomalous with respect to the rest of the authors work • Detect such passages because writing is “odd” not by using external resources (web) • Improving Corpora • Automatically gathered corpora can contain errors. Improve the integrity and homogeneity. • Unsolicited Email • E.g. Spam constructed from sentences • Undesirable Bulletin Board or Wiki posts • E.g. rants on wikipedia
Goals • To develop a general approach which recognizes: • different dimensions of anomaly • fairly small segments (50 to 100 words) • Multiple anomalous segments
Unsupervised • For this task we assume there is no training data available to characterize “normal” or “anomalous” language • When we first look at a document we have no idea which segments are “normal” and which are “anomalous” • Segments are anomalous with respect to the rest of the document not to a training corpus
Outlier Detection • Treat the problem as a type of outlier detection • We aim to find pieces of text in a corpus that differ significantly from the majority of text in that corpus and thus are ‘outliers’
Characterizing Text • 166 features computed for every piece of text (many of which have been used successfully for genre classification by Biber, Kessler, Argamon, …) • Simple Surface Features • Readability Measures • POS Distributions (RASP) • Vocabulary Obscurity • Emotional Affect (General Inquirer Dictionary)
Readability Measures • Attempt to provide a rough indication of the reading level required for a text • Purported to correspond how “easily” a text is read • Work well for differentiating certain texts ( Scores are Flesch Reading Ease) Romeo & Juliet 84 Plato’s Republic 69 Comic Books 92 Sports Illustrated 63 New York Times 39 IRS Code -6
Readability Measures • Flesch-Kincaid Reading Ease • Flesch-Kincaid Grade Level • Gunning-Fog Index • Coleman-Liau Formula • Automated Readability Index • Lix Formula • SMOG Index
Obscurity of Vocabulary • Implemented new features to capture vocabulary richness used in a segment of text • Lists of most frequent words in Gigaword • Measure distribution of words in a segment of text in each group of words • Top 1,000 words • Top 5,000 words • Top 10,000 words • Top 50,000 words • Top 100,000 words • Top 200,000 words • Top 300,000 words
Part-of-Speech • All segments are passed through the RASP (Robust and Accurate Statistical Parser) part-of-speech tagger • All words tagged with one of 155 part-of-speech tags from the CLAWS 2 tagset
• Diversity of POS trigrams Part-of-Speech • • % articles • • % prepositions • • % pronouns • • % adjectives • %conjuctions • Ratio of adjectives to nouns • % of sentences that begin with a subordinating or coordinating conjunctions (but, so, then, yet, if, because, unless, or…)
were made thinking apples be + ed make + ed think + ing apple + s Morphological Analysis • Texts are also run through the RASP morphological analyser, which produces words lemmas and inflectional affixes • Gather statistics about the percentage of passive sentences and amount of nominalization
Rank Features • Store lists ordered by the frequency of occurrence of certain stylistic phenomena Most frequent POS trigrams list Most frequent POS bigram list Most frequent POS list Most frequent Articles list Most frequent Prepositions list Most frequent Conjunctions list Most frequent Pronouns list
List Rank Similarity • To calculate the similarity between two segments lists, we use the Spearman’s Rank Correlation measure
Sentiment • General Inquirer Dictionary (Developed by social science department at Harvard) 7,800 words tagged with 114 categories: • Positive • Negative • Strong • Weak • Active • Passive • Overstated • Understated • Agreement • Disagreement and many more … • Negate • Casual slang • Think • Know • Compare • Person Relations • Need • Power Gain • Power Loss • Affection • Work
Representation • Characterize each piece of text (document, segment, paragraph, …) in our corpus as a vector of features • Use these vectors to construct a matrix, X, which has number of rows equal to the pieces of text in the corpus and number of columns equal to the number of features
Document or corpus Represent each piece of text as a vector of features Feature Matrix X
Document or corpus Identify outlying Text Feature Matrix X
Approaches • Mean Distance: • Compute average distance from other segments • Comp Distance: • compute a segment’s difference from its complement • SDE Distance • Find the projection of the data where segments appear farthest
Finding Outlying Segments Feature Matrix Dist = .5 • Calculate the distance from segment 1 to segment 2
Finding Outlying Segments Feature Matrix Dist=.3 • Calculate the distance from segment 1 to segment 3
Finding Outlying Segments Feature Matrix Build a Distance Matrix
Finding Outlying Segments Feature Matrix Choose the segment that is most different Distance Matrix outlier
seg f1 f2 f3 f4 f5 f6 f7 … fn 1 2 3 seg 1 2 3 4 5 6 7 … n 4 1 5 2 6 3 7 4 … 5 n 6 7 … n Ranking Segments Feature Matrix Distance Matrix Produce a Ranking of Segments List of Segments
Pearson Correlation Coefficient d = 1 - r Euclidean Distance City Block Distance Distance Measures Cosine Similarity Measure d = 1 - s
Standardizing Variables • Desirable for all variables to have about the same influence • We can express them each as deviations from their means in units of standard deviations (Z score) • Or Standardize all variables to have a minimum of zero and a maximum of one
Distance from complement New Document or corpus
Distance from complement Segment the text
Distance from complement Characterize one segment
seg f1 f2 f3 f4 f5 f6 f7 … fn 1 2 3 4 5 6 7 … n Distance from complement Characterize the complement of the segment
seg f1 f2 f3 f4 f5 f6 f7 … fn D=.4 1 2 3 4 5 6 7 … n Distance from complement Compute the distance between the two vectors
seg f1 f2 f3 f4 f5 f6 f7 … fn D=.4 1 2 3 4 5 6 7 … n Distance from complement For all segments
seg f1 f2 f3 f4 f5 f6 f7 … fn D=.4 1 2 3 4 5 6 7 … n Distance from complement D=.6 Compute distance between segments
Rank by distance from complement • Next, segments are ranked by their distance from the complement • In this scenario we can make good use of list features
SDE • Use the Stahel-Donoho Estimator (SDE) to identify outliers • Project the data down to one dimension and measure the outlyingness of each piece of text in that dimension • For every piece of text, the goal is to find a projection of the that maximizes its robust z-score • Especially suited to data with a large number of dimensions (features)