Download
1 / 12
120 likes | 295 Vues
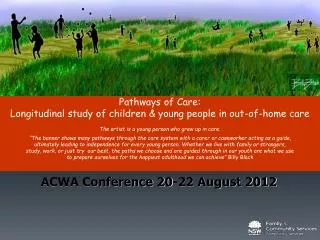
Education snapshot of children and young people in out-of-home care in NSW. Lo-Shu Wen Association of Childrens Welfare Agencies ACWA Conference 2010. Background. Initiated through ACWA’s OOHC Forum Poor educational outcomes for children and young people in out of home care.

E N D
Education snapshot of children and young people in out-of-home care in NSW Lo-Shu Wen Association of Childrens Welfare Agencies ACWA Conference 2010
Background • Initiated through ACWA’s OOHC Forum • Poor educational outcomes for children and young people in out of home care. • Need for more data on how children and young people in out of home care are performing in school. • Development of questionnaire to be used to capture a snapshot.
Research Process • Questionnaire sent to non-government agencies providing OOHC. • To be completed by caseworker, carer or similar. • No identifying information recorded. • Sent at the end of Term 3. First conducted in 2008 and then in 2009.
Out-of-Home Care in NSW • 34,069 children and young people in OOHC in Australia (AIHW, 2010). • 16,524 children and young people in care in NSW (Community Services, 2009). • In NSW, residential care wholly provided by NGOs. Foster care divided between Community Services and NGOs. • 78.2% Community Services, 21.8% NGOs – 1,921 children and young people (Wood Report, 2008).
Key Findings – Changes in School Change school at least once whilst in placement Top reasons: • Placement change • Child’s decision • Expulsion • Needs of the child
Key Findings – NAPLAN testing Example of NAPLAN reporting Child’s Mark National Average School Average NAPLAN Band
Key Findings – NAPLAN testing • Efficacy of NAPLAN results as basis of measurement for kids in OOHC. • Small sample that provided NAPLAN results. • Potential reasons for lack of reporting on NAPLAN. • School practices in relation to NAPLAN testing. • Inconclusive. Combining Year Groups NAPLAN Results
Further Work • Completion of reports for 2009 survey and cross analysis of 2008 and 2009. • Due to conduct the survey again in September 2010. • Focus efforts at increasing reporting of NAPLAN test results. • Potential impacts of new policies • Increase of compulsory school age to 17 • Keep Them Safe reforms • Education OOHC Coordinators • Education Learning Plans
Acknowledgements • Education Research Working Party • Boys Town Engadine • CREATE Foundation • Foster Parents Support Network • Life Without Barriers • Marist Youth Care • PhD Student, Southern Cross University • UnitingCare Burnside • Wesley Dalmar • Pamela Peters, social work student placement, UNSW
Contact Lo-Shu Wen, Policy Officer Association of Childrens Welfare Agencies (02) 9281 8822 loshu@acwa.asn.au http://www.acwa.asn.au