
Global Observations of Madden-Julian Oscillations
Study analyzes Madden-Julian Oscillation's impact on cloud, water vapor, and atmospheric variables using satellite data. Anomalies, propagation, and correlations are discussed.

Global Observations of Madden-Julian Oscillations
E N D
Presentation Transcript
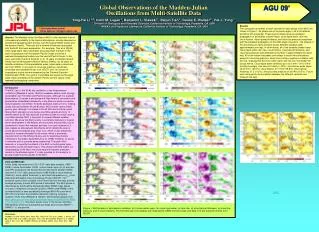
AGU 09’ Global Observations of the Madden-Julian Oscillations from Multi-Satellite Data King-Fai Li †,#, Colin M. Logan †, Benjamin L. Slawski †, Baijun Tian £, Duane E. Waliser £, Yuk L. Yung † † Division of Geological and Planetary Sciences, California Institute of Technology, Pasadena, CA, USA £NASA’s Jet Propulsion Laboratory, California Institute of Technology, Pasadena, CA, USA Results The composite anomalies of each variable for each phase of the MJO are shown in Figure 1. All graphs are of the same region (-30 to 30 latitude and 30 to 270 longitude). These figures clearly show an eastward propagation of anomalies of water vapor, cloud liquid water, rain rate, cloud fraction, cloud optical thickness, and cloud top pressure associated with the eastward propagation of the MJO deep convection. The shapes of the anomalies are fairly constant across different variables (with approximately zero lag). In other words, all of the variables (water vapor, cloud liquid water, rain rate, cloud fraction, cloud optical thickness, and cloud top pressure) were affected by the MJO in approximately the same way. All of the values had peaks and valleys in about the same places except for cloud top pressure, which has a strong negative correlation with the rest, implying that the more water vapor and rain are, the thicker the clouds will be. Cloud liquid water varied by up to ±0.5 mm (~31% of the monthly average), rain rate ±2.5 mm/hr (~22%), and column water vapor ±24.5 mm (~35.5%), cloud fraction (0-1) ±0.2 (19.6%), cloud optical thickness ±7.5 (11.5%), and cloud top pressure ±120 hPa (12.5%). Future work will quantify the correlation between the different variables and measure the lags. # Correspondence author Email address: kfl@gps.caltech.edu Abstract. The Madden-Julian Oscillation (MJO) is the dominant form of intraseasonal variability in the tropical atmosphere, usually observed as eastward propagating wave activity over the tropical Indian Ocean and the western Pacific. There are still a number of features associated with the MJO that need explanation. For example, Tian et al. [2006] notes large water vapor anomalies associated with the MJO in the lower troposphere over the eastern Pacific Ocean and even a westward propagating feature over the central Pacific Ocean. In this work, we further examine the MJO in (a) 10 years of satellite-tracked winds from the Atmospheric Motion Vectors (AMVs); (b) 22 years of satellite estimates of total precipitable water, liquid water content and rain from SSM/I; (c) 24 years of cloud-top pressure, cloudiness, shortwave and longwave fluxes from ISCCP; and, (d) 4 years of tropospheric ozone column measured by the Thermal Emission Spectrometer (TES). Our goal is to elucidate the causes for the large water vapor anomalies in the eastern Pacific and the nature of the westward propagating component. Fiigure 1. MJO phases of atmospheric variables: (a) Column water vapor, (b) cloud liquid water, (c) rain rate, (d) cloud optical thickness, (e) cloud top pressure, and (f) cloud fractions. The first three [(a)-(c)] variables are measured by SSM/I and are ocean-only data. The last three [(d)-(f)] are from ISCCP. Introduction The MJO (a.k.a. the 30-60 day oscillation or the intraseasonal oscillation) [Madden & Julian, 1994] is a weather pattern most strongly observable over the Indian and Pacific Oceans, although it is a global phenomenon. It causes a wet phase with high levels of convection and precipitation immediately followed by a dry phase in which convection and precipitation are limited. It travels eastward at about 5 m/s, making cycles that last between 30 and 60 days. MJO activity varies widely year-to-year, although it is related to the El Niño and La Niña cycles. Strong MJO typically occurs during a La Niña episode and 6 to 12 months before an El Niño episode, and there is little to no MJO during a La Niña episode. MJO is important to several different weather activities. We know that MJO activity is extremely important in tropical storm development in the Atlantic and monsoons around India, but its connection to most other weather activities is not yet understood. It also creates an atmospheric disturbance which affects the level of ozone above the affected area [Tian et al., 2007]. It also affects the amount of surface chlorophyll in the ocean, which is extremely important both for the fishing industry and for predicting cholera outbreaks in Southeast Asia [Waliser et al., 2005]. However, its cause is unknown and is currently being researched. The goal of this research is to quantify the effects of the MJO on hydrological cycle, particularly clouds and water vapor. This analysis will help further our understanding of the MJO and could help with weather prediction models in the affected region. It is also possible for this analysis to provide insight into the causes of the MJO. (a) (d) (b) (e) Data and Methods In this study, we employ the 0.25°0.25° daily data products (1987-2008) of cloud liquid water (CLW), column water vapor (H2O) and rain rate (RR) acquired by the Special Sensor Microwave Imager (SSM/I) and the 2.5°2.5° daily data products (1985-2008) of cloud fractions (CldFrac), cloud optical thickness () and cloud top pressure (pcld) from International Satellite Cloud Climatology Project (ISCCP). The seasonal cycle of each variable is first removed from the data, and the average anomaly in each MJO phase is calculated. The MJO phase is determined by the Realtime Multivariate MJO (RMM) index based on a pair of empirical orthogonal functions (RMM1 and RMM2) of the combined fields of near-equatorially averaged 850-hPa zonal wind, 200-hPa zonal wind, and satellite-observed outgoing longwave radiation (OLR) data [Wheeler & Hendon, 2004] (downloadable from http://cawcr.gov.au/bmrc/clfor/cfstaff/matw/maproom/RMM/RMM1RMM2.74toRealtime.txt). Only MJO events occur in the boreal (Northern Hemisphere) winter are considered and weak MJO events (RMM12 + RMM22 < 1) are ignored. (f) (c) References Madden & Julian (1994), Mon. Wea. Rev., 122,814; Tian et al. (2006), J. Atmos. Sci,63, 2462. Tian et al. (2007), Geophys. Res. Lett., 34, L08704; Waliser et al. (2005), Geoph. Res. Lett., 32, L23602; Wheeler & Hendon (2004), Mon. Wea. Rev., 132,1917.


