Download
1 / 14
140 likes | 260 Vues
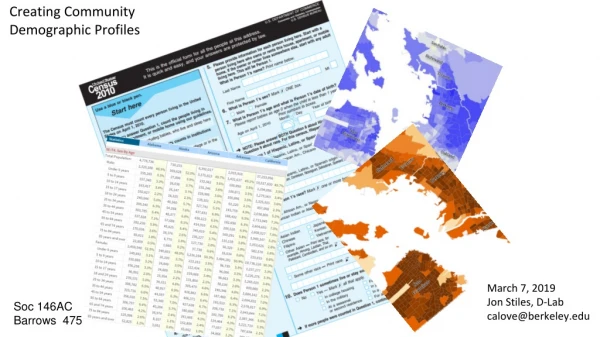
Prepared by Neighborhood Nexus and Atlanta Regional Commission March 1, 2013. Demographic Profiles of DeKalb School Board Districts. School Age Population (5-17). Key Points:

E N D
Prepared by Neighborhood Nexus and Atlanta Regional Commission March 1, 2013 Demographic Profiles of DeKalb School Board Districts
School Age Population (5-17) Key Points: District 2 has the smallest school age population. District 1 has the second smallest school age population. Thus the northern districts have the smallest school age populations Districts 5 and 6 have the highest (they are almost identical), with District 7 not far behind. Thus the southeastern districts have the largest school age populations. Source: ESRI Connecting Atlanta’s Communities
School Age Populations compared Key Points: What we are looking for is the same basic “shape” of the bars district-by-district. For the most part, we have that. District 4 is the lone exception in that it has a larger elementary school age relative to the overall “shape” of the bars in the middle school and high school graphs. Elementary Middle School High School Source: ESRI Connecting Atlanta’s Communities
Age 0-4 Key Points: District 7 has the largest number of kids ages 0 to 4, about 800 more kids than District 6, which had the lowest number of kids age 0-4. This is the population that will begin hitting elementary school next year. Source: ESRI Connecting Atlanta’s Communities
Elementary School Age (5-10) Key Points: District 5 has the largest number of elementary school age kids (ages 5 – 10). District 5 had a low 0-4 population, meaning that they will have extra capacity in the next few years in elementary schools due to low replacement numbers. District 6 is in a similar situation. District 2 had the lowest elementary school age population. District 7 has large populations in both the 0-4 and elementary school age group. Source: ESRI Connecting Atlanta’s Communities
Middle School Age (11-13) Key Points: District 6 has the largest number of middle school age kids. District 5 also has large numbers of elementary school age kids. District 6 is in a similar situation. District 2 had the lowest middle school age population AND the lowest elementary school age population. Districts 1 and 4 have the largest “gap” between elementary age and middle school age. (i.e. there are 4,500 more elementary age kids than middle school age kids in District 1). Source: ESRI Connecting Atlanta’s Communities
High School Age (14-17) Key Points: Districts 5 and 6 have the largest number of high school kids as well District 2 had the lowest high school age population, as well as the lowest middle school and elementary school age population. Source: ESRI Connecting Atlanta’s Communities
% White Population Key Points: Districts 1, 2 and 4 have the largest percentages of White population of any district, including in comparison to the State and DeKalb County as a whole. These districts also have the fewest school-age kids, but have relatively large populations of PRE-SCHOOL age kids. Source: ESRI Connecting Atlanta’s Communities
% Black Population Key Points: Districts 3, 5, 6 and 7 each have greater than 80 percent Black population, all well-higher than State and DeKalb averages. These districts also have the greatest number of school-age kids. District 7 also has the largest number of pre-school age kids Source: ESRI Connecting Atlanta’s Communities
% Hispanic Population Key Points: Districts 1, 2 and 4 have the largest percentages of Hispanic population of any district. (They also had the highest percentages of White population). Districts 1 and 4 have more the double the percentage that Georgia and DeKalb have. Source: ESRI Connecting Atlanta’s Communities
% Asian Population Key Points: Districts 1, 2 and 4 have the largest percentages of Asian population of any district. (They also had the highest percentages of White and Hispanic population). District 7 also has a relatively large Asian population when compared to State and DeKalb averages. Source: ESRI Connecting Atlanta’s Communities
Household Income Key Points: Districts 1 has, by far, the highest household income of the districts, roughly 40% higher than Georgia’s household income. District 3 has the lowest household income, about 25% lower than Georgia’s household income. The other districts are similar in terms of household income. Source: ESRI Connecting Atlanta’s Communities
Household Income Key Points: Districts 1 has, by far, the highest household income of the districts, roughly 40% higher than Georgia’s household income. District 3 has the lowest household income, about 25% lower than Georgia’s household income. The other districts are similar in terms of household income. Source: ESRI Connecting Atlanta’s Communities
Home Value Key Points: Districts 1 has the highest median home value, followed by Districts 2 and 4. These districts happen to have to lowest school-age populations. The other districts have roughly the same median home value, but have many more school-age children. Source: ESRI Connecting Atlanta’s Communities