Objective, Satellite-Based Tropical Cyclone Center-Fixing
330 likes | 555 Vues
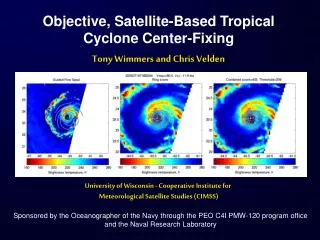
Objective, Satellite-Based Tropical Cyclone Center-Fixing . Tony Wimmers and Chris Velden. University of Wisconsin - Cooperative Institute for Meteorological Satellite Studies (CIMSS).

Objective, Satellite-Based Tropical Cyclone Center-Fixing
E N D
Presentation Transcript
Objective, Satellite-Based Tropical Cyclone Center-Fixing Tony Wimmers and Chris Velden University of Wisconsin - Cooperative Institute for Meteorological Satellite Studies (CIMSS) Sponsored by the Oceanographer of the Navy through the PEO C4I PMW-120 program office and the Naval Research Laboratory
“First guess” Center fix Principal Goal Create an objective, automated algorithm to locate the rotational centers of TCs evident in microwave, IR, or visible images Should be resilient to identifying “false eyes” (moats) but robust enough to detect partial eyes and convergent cloud spiral signatures Should rely only loosely on a first-guess (forecast) position estimate Should provide position estimate uncertainty indices
ARCHER: Automated Rotational Center Hurricane Eye Retrieval Wimmers, A. J., and C. S. Velden, 2010: Objectively determining the rotational center of tropical cyclones in passive microwave satellite imagery. Journal of App. Meteor and Clim., e-View doi: 10.1175/2010JAMC2490.1 ARCHER research/development status Returns a numerical score that relates to an estimated center position, a 2-D score field that corresponds to the likelihood of having found the correct position, andeyewalldiameter if an eyewall is identified Currently operates on the following:
3) Combine the two 2D fields as a weighted sum into a single score field 2) Produce a separate 2D field that rates how well a location is centered inside a circular ring of convection “Combined Score” “Ring Score” “Spiral Score” Basic ARCHER Approach 1) Produce a 2D field (contoured) that expresses how well a location registers as the center of the large-scale spiral pattern
Spiral-fitting concept Circulation is indicated by spirally-oriented bands caused by convergent flow and horizontal shearing
Spiral-fitting concept Algorithm: determine the alignment of the image gradients with a spiral vector field
“Spiral Score” component spiral unit vector field centered on (,) gradient of the log of the image (lon, lat) • Calculated at every sample point (dot) on the TC image, then interpolated to the resolution of the image (contour plot) • High values occur where the vector field lines up with the image gradients
“Ring score” component The scores are proportional to the average dot product of the image gradient and a radial unit vector on a ring Ring scores are assigned to the center of a ring of points inside an eyewall
Center fix Combined (final) ARCHER score “First guess” Best track wSS is the “relative weight” (next slide) Lat/Lon of max(CS) point is final ARCHER estimate of TC center fix
Additional Procedures Images are pre-processed to compensate for any parallax shift, and then resampled to a 0.05 rectangular grid We introduce a small “penalty” for positions that stray far from the first guess, to help mitigate gross errors If the Combined Score does not exceed a fixed threshold value, then the algorithm can default back to the first guess (OFC forecast) position The relative weight and the combined score thresholds are dependent on sensor type, and for MW are calibrated for three modes that each behave differently under the ARCHER scheme: Tropical Storm, Cat 1, and Cat 2-5 strength TCs
Example: Unresolved eye (Dennis 2005) 1) Wider domain
Example: Unresolved eye (Dennis 2005) 2) Zoomed view
Example: Unresolved eye (Dennis 2005) 3) With best track position
Example: Unresolved eye (Dennis 2005) 4) With simulated forecast position (first guess)
Example: Unresolved eye (Dennis 2005) 5) Spiral score
Example: Unresolved eye (Dennis 2005) 6) Ring score
Example: Unresolved eye (Dennis 2005) 7) Combined score
“First guess” Example: Unresolved eye (Dennis 2005) 8) Compare to best track position Center fix Best track
Example: Evolving eyewall (Chaba 2010) Oct 28 04:40 Z Vmax=115 kts 1. Complete eyewall Center-fix
Example: Evolving eyewall Oct 28 09:33 Z Vmax=112 kts 2. Shearing leads to asymmetric eyewall pattern Center-fix
Example: Evolving eyewall Oct 28 10:52 Z Vmax=111 kts 3. Eyewall only evident on the western side Center-fix
Example: Evolving eyewall Oct 28 22:02 Z Vmax=105 kts 4. Sub-pixel core and banding only on the west Center-fix
Example: Evolving eyewall Oct 29 07:56 Z Vmax=90 kts 5. Sub-pixel eye and a developing secondary eyewall Center-fix
Example: Evolving eyewall Oct 29 20:38 Z Vmax=75kts 6. Completed eyewall replacement cycle Center-fix
Validation: 2005 season, North Atlantic Independent from calibration sample, 85GHz only 40% tropical storm, 20% Cat 1, 40% Cat 2-5 Simulated forecast position errors of 0.1, 0.4 and 0.7 for each image, weighted to match the distribution of typical forecast fix errors in the NATL Validation uses cases that are < 3 hours from an aircraft position fix. NHC Best Track is used as “truth.”
Validation Results, 85-92 GHz Defaults are defined as those cases where ARCHER did not exceed thresholds and the first guess forecast position is retained The RMS errors have been adjusted to account for the displacement between the rotational center at the surface and at the image level Errors are ~5% larger in other basins due to greater OFC forecast position error Errors improve with increasing Vmax (organization/structure)
(Low organization) (Medium organization) (High organization) ARCHER: Adapting to IR imagery Organization score = 0.91 Organization score = 1.55 Organization score = 2.60 The ADT (next presentation by Olander) employs a forerunner version of ARCHER that operates on IR data. It uses an ad hoc rules-based approach and is very resilient to big false-positives. We are developing a more effective ARCHER-IR method with better cal/val, good theoretical connections to ARCHER-MW, and including uncertainty information. Latest scheme still under development
Graphical output: Spiral grid Combined grid ARCHER-IR: Example output Center-fix • Numerical output: • Forecast position (lon, lat): -61.10, 36.70 • Center-fix position (lon, lat): -60.81, 36.47 • Eye confidence (%) = 31 • Error distribution parameter (alpha) = 6.39 • Probability of error < 0.2° (%) = 36.5 • Probability of error < 0.4° (%) = 72.4 • Probability of error < 0.6° (%) = 90.0 • Probability of error < 1.0° (%) = 98.8 Often ~95% for more organized TCs
Cal/Val results, All IR imagery The independent validation showed probabilities greater than or equal to these benchmark certainty values It is not necessary to vary any ARCHER parameters with TC intensity. (Not so with MW.)
ARCHER Microwave Intensity Application ARCHER MW intensity estimates are now integrated into the Advanced Dvorak Technique algorithm (further details in next presentation on the ADT) Method: Score is based on the robustness of the eyewall structure as depicted in 85GHz brightness temperatures, and is objectively determined from two parameters: “Difference component”: Measure the difference between the warmest pixel in the eye and the warmest pixel on the eyewall ring (similar to the Dvorak Technique) “Completeness component”: Add 15 points to the score if … >85% of the points on the eyewall are <232K (“the absolute measure”) OR >85% of the points on the eyewall are >20K colder than the warmest pixel in the eye (“the relative measure) MW scores are generally between 0 (no structure, weak TC) and 100 (powerful TC) Conversion to ADT Vmax: Scores >20 Vmax ≥ 72 kts, Scores >60 Vmax ≥ 90 kts Difference component: 268K (eye pixel) - 251K (warmest eyewall pixel) = 17 points Completeness component: 93% of eyewall pixels >20K colder than warmest pixel in eye +15 points Result: Score: 17+15 = 32 ADT Vmax = 72 kts (JTWC estimate was 65 kts at this time) Example: Image for TC 26W (2009) [24 Nov 1052 UTC]
ARCHER-ADT Methodology Summary • If the MW score exceeds 20, the ADT current intensity value is reset to 72kts IF the ADT has not yet identified an EYE scene type. • If the MW score exceeds 60, the ADT current intensity value is reset to 90kts IF the ADT has not yet identified an EYE scene type. • If the ADT analyzes an EYE scene before the MW scores exceed the 20 threshold, then the MW is not used. • Currently, the MW scores are only employed in the ADT for TC formative stages. The ARCHER method’s estimates are not robust enough in other TC stages, as indicated by validation studies. An approach being developed at NRL may be promising (later presentation by Hawkins). Application of the MW intensity scores to the ADT
Summary A fully automated and objective TC center finding routine based solely on satellite imagery has been developed, called ARCHER. The primary version that operates on 85GHz passive microwave imagery has been fully tested and validated, with an overall RMS center-fix position error of 0.15. In general, accuracy increases with TC intensity. A new version still under development for geostationary IR imagery yields a center fix along with a certainty estimate, allowing more options for the end-user. ARCHER can also diagnose intensity estimates from 85GHz imagery in developing TC cases. These estimates are now passed to the ADT. Other ARCHER applications not discussed here include TC visualization, eyewall diameter retrieval, rapid intensification, 37GHz and Vis apps.
Final Remarks Distribution A free, licensed version of ARCHER is available for distribution (Matlab code). The user must have a source for the input satellite data and OFC track forecasts. HURSAT ARCHER has been tested by NCDC on the IBTrACS HURSAT dataset (Knapp) and yields good results, and will be further employed in the IBTrACS project. Ongoing work Current research involves a cross-comparison of ARCHER accuracy from microwave, IR and Visible imagery, and deriving an optimal approach to combine coincident multispectral results into a single “best” estimate. Looking into the possibility of extending ARCHER to operate on 37GHz imagery. Acknowledgments Special thanks to Jeff Hawkins of the Naval Research Laboratory, and the Office of Naval Research for the support towards the development and continued advancement of the ARCHER!