Download
1 / 52
540 likes | 841 Vues
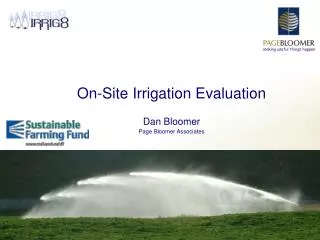
On-Site Irrigation Evaluation. Dan Bloomer Page Bloomer Associates. On-Site Irrigation Evaluation. SFF Project 02-051 Code of Practice IRRIG8 support software National Certificate in Irrigation Evaluation Training programmes Certified practitioners. Keys to improving performance.

E N D
On-Site Irrigation Evaluation Dan Bloomer Page Bloomer Associates
On-Site Irrigation Evaluation • SFF Project 02-051 • Code of Practice • IRRIG8 support software • National Certificate in Irrigation Evaluation • Training programmes • Certified practitioners
Keys to improving performance • Measure what is actually happening • Determine causes of low performance • Propose solutions • At an affordable cost
Code of Practice for Irrigation Evaluation • Schedules and protocols • Distribution Uniformity and Application Efficiency • Seasonal Irrigation Efficiency • Other KPI assessments • IRRIG8 Support software • Standardises data processing • Completes repetitive calculations • Avoids errors and reduces costs • Generates standardised reports
What are we trying to achieve? • Improved irrigation efficiency • Crop per litre • Crop per dollar • Better system performance • Water use efficiency • Energy efficiency • Better irrigation management • Correct scheduling • Minimum environmental impact
Key Performance Indicators KPI’sShared with CoP Irrigation Design • Water use • Efficiency • Distribution Uniformity • Application Efficiency • Effectiveness • Potential Soil Moisture Deficit • Compliance • Environment • Application Efficiency • Deep percolation • Energy • kWhr/ha/mm • Labour • Capital
Application Efficiency • How much water applied was stored in the soil and available to plants? • Potential AE for a single event • Estimate from DU, applied depth and soil AWC
Application Efficiency Water Stored in Root Zone (mm) Total Water Applied (mm) • Compares water used for growth with total water used • Requires knowledge of: • soil moisture holding • crop water use • water inputs – rain and irrigation
Solid Set Rotating Boom Fixed Boom Travelling Gun Centre Pivot Linear Move *Multiple sprayline Side Roll Drip Microspray Bubbler Low Head Basin Paddy Basin Border Strip Furrow Modern Furrow 0 20 40 60 80 100 percent efficiency Potential Application Efficiencies Assuming enough irrigation is applied to adequately water 7/8ths of the field Adapted from A.J. Clemmens
Distribution Uniformity • Sets capacity for Efficient and Effective Irrigation • How evenly is the water applied to the plants? • A single event measurement • Consider smallest area that needs adequate watering; each vine, tree, wheat/grass plant • Measures • Christiansen Uniformity CU • Distribution Uniformity DU • Emission Uniformity EU
Irrigation is Not Uniform Ineffective Inefficient
Distribution Uniformity • Irrigation is not uniform • Irrigate to adequately water most of the crop • Some will be too wet, some too dry • Try to minimise the difference • Low quarter uniformity, DUlq • Compare mean of low quarter to overall mean • Schedule irrigation depth based on DUlq • Implies 7/8ths will get enough or more • Raise DUlq from 0.70 to 0.90 • Water half as much again for same volume of water • Or save one third of water and power
DUlq = 0.90 Total flow = 9600ml Low quarter mean = 540 ml Overall mean = 600ml DUlq = 540/600 = 0.90 To water 7/8 with > 3,000ml Apply 3,000ml/0.9 = 3,335ml Total needed = 53,360ml Wastage = 5,360ml (enough for 1.8 more plants)
DUlq = 0.50 Total flow = 9600ml Low quarter mean = 300ml Overall mean = 600ml DUlq = 300/600 = 0.50 To water 7/8 with > 3,000ml Apply 3,000ml/0.50 = 6,000ml Total for16 plant s = 96,000ml Wastage = 48,000ml (enough for 16 more plants)
Linear move Application Uniformity (DUlq) = 0.88 To adequately water 7/8ths apply 13% extra Project no. 04018
Centre Pivot Application Uniformity (DUlq) = 0.72 To adequately water 7/8ths apply 39% extra
DUlq = 0.96 Centre Pivot Distribution Pattern DUlq = 0.72
Surface ponding often apparent toward end of machines. Instantaneous application rate exceeds soil infiltration rate, - redistribution will lower actual uniformity further
200 175 150 125 100 75 25 0 Water Application Rate mm/hr From Nelson Irrigation: Pivot Pocket Guide
No overlap With overlap Application Uniformity (DUlq) 0.82 Traveller with Fixed Boom Project no. 04014
No overlap With overlap Application Uniformity (DUlq) 0.84 Traveller with Rotating Boom Project no. 05005
Excessive application led to ponding, runoff and the excess was drained away.
Multiple lateral sprayline Project no. 05003
Optimising Irrigation System Performance and Management K-Line
Multiple lateral sprayline Application Uniformity (DUlq) 0.4 Not overlapped Overlapped Depths after 1 hour test, normal run time 24 hours To adequately water 7/8ths apply 250 % extra Project no. 05003
K-Line Wind Effects Wind from left Not overlapped No Wind Not overlapped Depths after 1 hour test, normal run time 24 hours Depths after 2 hour test, normal run time 11 hours Project no. 05003
K-Line Wind Effects Wind from left Overlapped No Wind Overlapped Depths after 1 hour test, normal run time 24 hours Depths after 2 hour test, normal run time 11 hours Project no. 05003
Optimising Irrigation System Performance and Management K-Line Spacing Effects Lane Spacing is Very Important Lane Spacing Grid DU Field DU 12m 0.42 0.36 14m 0.44 0.38 16m 0.35 0.30 18m 0.21 0.18 All use same pressure variation factor
Drip/Micro Irrigation Issues System does not water entire soil volume • Typically no overlapping • Nozzle plugging • Low pressures • Elevation changes • Pressure reg differences • Poorly controlled pressures • Unequal drainage
Drip-Micro Uniformity Assessment • Key measurements • Flows from selected emitters • Pressures across system • System layout/emitter spacings • Uneven drainage
Drip-Micro Irrigation Typical system layout
Drip-Micro Irrigation Pressure measurement
Loss component Range Typical Leaking pipes 0-10% 0-1% Evaporation in the air 0-10% <3% Wind blowing water off target (drift) 0-20% <5% Interception (canopy losses) 0-10% <5% Surface runoff (spray irrigation) 0-10% <2% Uneven application or excessive application depths and rates 5-80% 5-30% What are the main inefficiencies? Lincoln Environmental Data
Seasonal Irrigation Efficiency • Assess scheduling decisions • Account for: • Distribution Uniformity • Climate • Crop type and stage • Soil type • Key Performance Indicators • Seasonal application efficiency • Potential soil moisture deficit • Deep percolation resulting from irrigation • Estimate value of wasted energy and lost yields
Seasonal Irrigation Efficiency • What is your management like? • Few have the farm data needed • No water use data • No power use data • No irrigation application data • No rain or ET data