Download
1 / 7
70 likes | 201 Vues
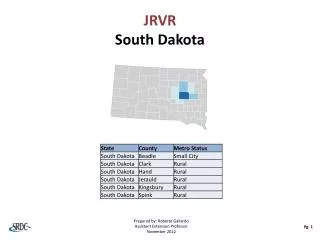
HWeGrow South Dakota. Prepared by: Roberto Gallardo Assistant Extension Professor November 2012. Pg. 1. HWeGrow – South Dakota. Pre-Defined* Clusters. *For a list of six-digit NAICS codes industries within each cluster see separate file Source: EMSI Complete employment – 2012.2.

E N D
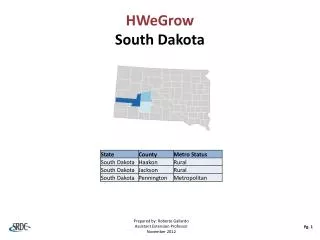
HWeGrowSouth Dakota Prepared by: Roberto Gallardo Assistant Extension Professor November 2012 Pg. 1
HWeGrow – South Dakota Pre-Defined* Clusters *For a list of six-digit NAICS codes industries within each cluster see separate file Source: EMSI Complete employment – 2012.2 Last Updated: October 2012 Pg. 2
HWeGrow – South Dakota (2002-2007) Electrical Mining 2002-2007 % Change Jobs Business & Financial Printing Transp. & Logistics Energy Primary Metal AER Defense Biomedical IT Telecomm Fabricated Metal Transp. Equipment 2007 LQ Pg. 3 Bubble size represents cluster’s average earnings in 2012 ; Source: EMSI Complete Employment – 2012.2
HWeGrow – South Dakota (2007-2012) Primary Metal 2007-2012 % Change Jobs Electrical Mining Education Business & Financial Transp. &Logistics Transp. Equipment Defense AER Energy Biomedical Machinery IT Telecomm Computer 2012 LQ Pg. 4 Bubble size represents cluster’s average earnings in 2012; Source: EMSI Complete Employment – 2012.2
HWeGrow–South Dakota 2002-2007 Bubble Chart Results *Clusters were ranked in descending order based on their 2007 LQ Source: EMSI Complete Employment – 2012.2 Pg. 5
HWeGrow–South Dakota 2007-2012 Bubble Chart Results *Clusters were ranked in descending order based on their 2012 LQ Source: EMSI Complete Employment – 2012.2 Pg. 6
HWeGrow–South Dakota 2012 Expenditures & Leakage* *Only top 20 industries used to calculate the leakage Sorted in descending order based on total expenditures Source: EMSI Complete Employment – 2011.4 Pg. 7