Where we’re going
270 likes | 443 Vues
Where we’re going. Frequency Space. Speed, Storage Issues. Fourier Analysis. Sine waves can be mixed with DC signals, or with other sine waves to produce new waveforms. Here is one example of a complex waveform :. A o. Just an AC component superimposed on a DC component. A 1.

Where we’re going
E N D
Presentation Transcript
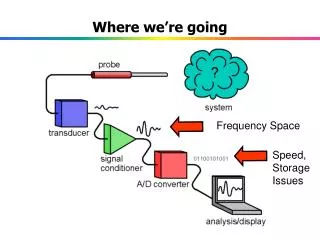
Where we’re going Frequency Space Speed, Storage Issues
Fourier Analysis Sine waves can be mixed with DC signals, or with other sine waves to produce new waveforms. Here is one example of a complex waveform: Ao Just an AC component superimposed on a DC component A1 V(t) = Ao + A1sin1t + A2sin 2t + A3sin 3t + … + Ansin nt --- in this case--- V(t) = Ao + A1sin1t
Fourier Analysis, cont’d More dramatic results are obtained by mixing a sine wave of a particular frequency with exact multiples of the same frequency. We are adding harmonics to the fundamental frequency. For example, take the fundamental frequency and add 3rd harmonic (3 times the fundamental frequency) at reduced amplitude, and subsequently add its 5th, 7th and 9th harmonics: the waveform begins to look more and more like a square wave.
Fourier Analysis, cont’d This result illustrates a general principle first formulated by the French mathematician Joseph Fourier, namely that any complex waveform can be built up from a pure sine waves plus particular harmonics of the fundamental frequency. Square waves, triangular waves and sawtooth waves can all be produced in this way. (try plotting this using Excel)
Spectral Analysis • Spectral analysis means determining the frequency content of the data signal • Important in experiment design for determining sample rate, fs- sampling rate theorem states: fs max fsignal to avoid aliasing • Important in post-experiment analysis- Frequency content is often a primary experiment result. Experiment examples:- determining the vibrational frequencies of structures - reducing noise of machines - Developing voice recognition software
Spectral analysis key points Any function of time can be made up by adding sine and cosine function of different amplitudes, frequencies, and phases. These sines and cosines are called frequency components or harmonics. Any waveform other than a simple sine or cosine has more than one frequency component.
Example Waveform • 1000 Hz sawtooth, amplitude 2 Volts Period, T = .001 sec Harmonic terms Fundamental frequency term b0 is the average value of the function over period, T
Fourier Coefficients, an and bn • These coefficients are simply the amplitude at each component frequency • For odd functions [f(t)=-f(-t)], all bn= 0, and have a series of sine terms (sine is an odd function) • For even functions [f(t)=f(-t)], all an= 0, and have a series of cosine terms (cosine is an even function) • For arbitrary functions, have an and bn terms. • Coefficients are calculated as follows:
More odd functions Fundamental or First Harmonic Sine series or Pure imaginary amplitudes Third Harmonic
More even functions Fundamental or First Harmonic Cosine series or Pure real amplitudes Second Harmonic
Periodic, but neither even nor odd Cosine and sine series or Complex amplitudes
Our sawtooth wave is an ________ function. Therefore all ____ = 0 Sawtooth Fourier Coefficients • Odd function so: • Using direct integration or numerical integration we find the first seven an’s to be: • We can plot these coefficients in frequency space:
Let’s transform a “Sharper” sawtooth Even or odd?
Frequency Domain Plot of Fourier Coefficients Get “power spectrum” by squaring Fourier coefficients
Construction of Sharp Sawtooth by Adding 1st, 2nd, 3rd Harmonic Second Harmonic First Harmonic Third Harmonic
Spectral Analysis of Arbitrary Functions • In general, there is no requirement that f(t) be a periodic function • We can force a function to be periodic simply by duplicating the function in time (text fig 5.10) • We can transform any waveform to determine it’s Fourier spectrum • Computer software has been developed to do this as a matter of routine. - One such technique is called “Fast Fourier Transform” or FFT- Excel has an FFT routine built in
Voice Recognition The “ee” sound
Voice Recognition (continued) The “eh” sound
Voice Recognition (continued) The “ah” sound
Voice Recognition (continued) The “oh” sound
Voice Recognition (continued) The “oo” sound