Download
1 / 19
190 likes | 347 Vues
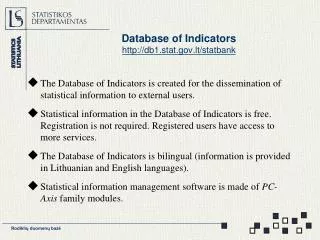
Database of Indicators http://db1.stat.gov.lt/statbank. The Database of Indicators is created for the dissemination of statistical information to external users.

E N D
Database of Indicatorshttp://db1.stat.gov.lt/statbank • The Database of Indicators is created for the dissemination of statistical information to external users. • Statistical information in the Database of Indicators is free. Registration is not required. Registered users have access to more services. • The Database of Indicators is bilingual (information is provided in Lithuanian and English languages). • Statistical information management software is made of PC-Axis family modules. Rodiklių duomenų bazė
Key functions of the Database of Indicators on the Internet • Statistical information viewing on screen • Table editing • Table saving in selected format • Graphical representation of data Rodiklių duomenų bazė
Database of IndicatorsFirst Page Logon of registered users. Language. Help. Search. Registration of new user Hierarchy tree Main news of the Database of Indicators published here. Logon of registered users. Registration of new user. List of 20 recently updated tables Rodiklių duomenų bazė
Statistical information tree Tables are systemized by thematic domains. Thematic domains and tables of one statistical area are displayed. The symbol „>>>“ and attribute „administrative territory“ mark tables by counties and municipalities. Rodiklių duomenų bazė
Table sample Selection window Statistical indicators In the menu you can select “Mark all” or “Remove marking” Function “Select counties”: counties are selected Values are marked in a standard manner – using mouse. Holding SHIFT allows marking in succession, CTRL – not in succession. Select values in all selection windows and click “Show table”. Rodiklių duomenų bazė
Table sample Selection windows If classification is very wide, positions in a selection window are not displayed. In that case you have to click on the window and you will get advanced selection window. Rodiklių duomenų bazė
Table sample Advanced selection window is used for theselection of values when classification is wide. 2. In this field indicate the word by which you want the search to be performed or the code. If you leave this field empty, search window will provide all classification values. 1. Indicate in which classification you want the search to be performed 5. After having selected values click “Continue” and return to selection window. 3. Search window. Values appear in this window by clicking “Search”. 4. Selected values window. Values areadded or deleted by clicking “Add” or “Delete”. Rodiklių duomenų bazė
Table sample Indicate the format in which you want the table to be saved (Excel, PX-Axis, etc.) Tables up to 1000 data cells are displayed. Statistical information can be presented in diagrams. Statistical information by counties and municipalities can be presented in map. Table display can be changed by rotating clockwise or by changing the attributes’ order. Attributes with codes can also be presented. Information about measure unit, contact person, footnote (if there is one) is provided below the table. Rodiklių duomenų bazė
Table sample Diagram settings can be changed Diagram and map Map settings can be changed Rodiklių duomenų bazė
Registered users Registered users can: • adjust statistical information to their needs; • select tables of larger volume (1000–100000 data cells); • save tables and use them later; • create lists of selected values and accelerate selection; • receive news by Email. Rodiklių duomenų bazė
Registered users You can register as a new user on the first page: User name and password: 4–10 symbols Rodiklių duomenų bazė
Registered users Information about user. Don’t forget to indicate correct Email. User profile User profile Settings: you can change layout of first page, default search and period layout Rodiklių duomenų bazė
Registered users Saving tables for later use List of tables saved by user You can save the selected statistical information for later use: name it, set period update method Rodiklių duomenų bazė
Registered users You can create folders and sort the saved tables by these folders. List of tables saved by users Tables, update notifications on which are sent by Email, are marked with envelope symbol. You can select go to the table or its settings. Rodiklių duomenų bazė
Registered users Working with tables when more than 1000 data cells are selected If you select more than 1000 data cells, the table will not be displayed. You have to select format in which you will download the table. You can download PC-Axis and PX-Map software. Rodiklių duomenų bazė
Registered users Creating a list of selected values. E.g., most often you are interested only in transport-related enterprises (EVRK 60–63) 1. Select positions you are interested in 3. Save the list for later use 2. Name the list of attributes, e.g. Food Rodiklių duomenų bazė
Registered users Creating a list of selected values: Now the list of selected values “Food” has appeared in the selection window Having selected “Food”, appropriate values are selected Rodiklių duomenų bazė
Search Search is performed strictly by the word written. Therefore, write stem of a word: Information about search results In case of large number of search results you can specify the search among results Links to the tables where word “age” was found Rodiklių duomenų bazė
Help Help On the top of every page of the Database of Indicators there is “Help” function where you can find advice according to your actions. E.g, if you opened selection window, “Help” will give advice how to find and select the values. Rodiklių duomenų bazė