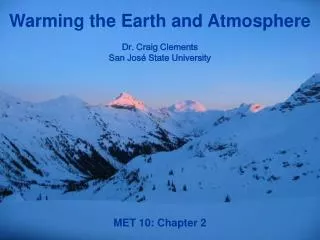
MET 10 Lecture 7
MET 10 Lecture 7. Air Pressure and Winds Chapter 6 Dr. Craig Clements San Jose State University. Hydrologic Cycle. Atmospheric Pressure. Air pressure is simply the mass of air above a given level.

MET 10 Lecture 7
E N D
Presentation Transcript
MET 10 Lecture 7 Air Pressure and Winds Chapter 6 Dr. Craig Clements San Jose State University
Atmospheric Pressure Air pressure is simply the mass of air above a given level. As we climb in elevation there are fewer air molecules above us; atmospheric pressure decreases with height. What causes air pressure to change in the horizontal? Why does air pressure change at the surface?
A simplified model • Dots represent air molecules • We assume that: • Air molecules are not crowded • close to the surface • Air density remains constant from • surface to top of column. • 3. Width of column does not change • 4. Air is unable to freely move into or • out of the column.
Two air columns, each identical mass, have same surface pressure. Important concept: Warm air aloft is normally associated with high atmospheric pressure, and cold air aloft is associated with low pressure.
Becoming more stable Horizontal difference in temperature creates a horizontal difference in pressure. The pressure difference establishes a force (called Pressure Gradient Force) that causes the air to move from higher pressure toward lower pressure.
Air above a region of surface high pressure is more dense than air above a region of surface low pressure (at the same temperature). (The dots in each column represent air molecules.)
A barometer is an instrument that measures atmospheric pressure. The mercury barometer. The height of the mercury column is a measure of atmospheric pressure.
Sea-level pressure vs. station pressure The barometer reading at a particular location is called station pressure. This is the pressure that has been corrected for temperature, gravity, and instrument error. Since pressure varies with altitude, the pressure at stations of different altitudes must be corrected in order to compare them. This adjusted pressure is called sea-level pressure.
The top diagram (a) shows four cities (A, B, C, and D) at varying elevations above sea level, all with different station pressures. The middle diagram (b) represents sea-level pressures of the four cities plotted on a sea-level chart. The bottom diagram (c) shows isobars drawn on the chart (dark lines) at intervals of 4 millibars.
Surface and Upper-Air Charts Isobaric maps: maps of constant pressure are constructed to show height variations along a constant pressure surface (isobaric surface). Lines of constant pressure = isobars Contour lines– lines that connect points of equal elevation above sea level. Lines of low height = region of low pressure Lines of high height = region of high pressure Lines of constant temperature = isotherms
Surface and Upper-Air Charts What does upper-air mean? At what level do we consider upper-level? Typically, we discuss surface pressures and upper-air. when we refer to upper-air levels we use pressure as our height coordinate. For example, common levels we use: 850 mb = ~5,000 ft above sea level. 700 mb = ~10,000 ft above sea level 500 mb = ~16,000 ft above sea level (5000 m) 300 mb = ~29,000 ft above sea level (9000 m) The 300 mb level is the jet stream level.
Areas of low pressure (L) and high pressure (H) are shown. Arrows indicate wind direction– the direction from which the wind is blowing. Areas of high pressure are also called anti-cyclones.
Ridge • When the height contoursbend strongly to the north, this is known as a Ridge. • Strong ridges are accompanied by warm and dry weather conditions at the surface. Trough • When the height contours bend strongly to the south, (as in the diagram below), it is called a trough. • Strong troughs are typically preceded by stormy weather and colder air at the surface.
Why the wind blows Newton’s Laws of Motion. Newton’s first law of motion states that an object at rest will remain at rest and object in motion will remain in in motion as long as no force is exerted on the object. Newton’s second law of motion states: that the force exerted on an object = its mass times the acceleration produced. F= ma To determine which direction the wind will blow we must identify and examine all the forces that affect the horizontal movement of air.
Why the wind blows • To determine which direction the wind will blow we must identify and examine all the forces that affect the horizontal movement of air. • These forces include: • Pressure gradient force • Coriolis force • Centripetal force • Friction
Pressure Gradient Force When differences in horizontal air pressure exist there is a net force acting on the air. This force is the Pressure Gradient Force (PGF) and is directed from higher toward lower pressure at right angles to the isobars. The magnitude of the force is directly related to the pressure gradient. Steep pressure gradients correspond to strong forces. Pressure Gradient is the change of pressure over a given distance: Pressure Gradient = pressure difference / distance. Closer the isobars = steeper the gradient = stronger force
What is the PGF between P1 and P2? 4 mb per 100 km
Coriolis Force • Is an apparent force that is due to the rotation of the earth. • The Coriolis force causes the wind to deflect to the rightof • its intended path in the Northern Hemisphere and to the • left of its path in the Southern Hemisphere. • The amount of deflection due to the Coriolis force depends • upon: • The rotation of the earth • The latitude • The object’s speed • The Coriolis force acts at right angles to the wind, and only influences wind direction not speed.
Except at the equator, a free-moving object heading either east or west (or any other direction) will appear from the earth to deviate from its path as the earth rotates beneath it. The deviation (Coriolis force) is greatest at the poles and decreases to zero at the equator. The Coriolis force “behaves” as a real force, constantly tending to “pull” the wind.
When isobars are widely spaced, the flow is weak; when they are narrowly spaced, the flow is stronger. The increase in winds on the chart results in a stronger Coriolis force (CF ), which balances a larger pressure gradient force (PGF ).
Winds around Lows and Highs Winds and related forces around areas of low and high pressure above the friction level in the Northern Hemisphere. Notice that the pressure gradient force (PGF ) is in red, while the Coriolis force (CF ) is in blue.
Curved Winds around Lows and Highs A wind blowing at a constant speed, but parallel to curved isobars above the level of surface friction is termed: gradient wind. A gradient wind blowing around a a low-pressure center is constantly accelerating because it is constantly changing direction. This acceleration is called centripetal acceleration. Centripetal acceleration is directed at right angles to the wind, inward toward the low center. The net force acting on the wind must be directed toward the center of the low in order for the air to keep moving in a counterclockwise, circular path. This inward-directed force is called centripetal force: imbalance between Coriolis and PGF.
Winds around Lows and Highs centripetal force centripetal force: inward-directed force caused by an imbalance between the Coriolis force and PGF.
An upper-level 500-mb map showing wind direction,indicated by lines that parallel the wind.
Surface Winds Winds on a surface weather map do not blow exactly parallel to the isobars; instead they cross the isobars moving higher to lower pressure. The angle at which the wind crosses the isobars varies, but averages 30°. The frictional drag of the ground slows the wind down. Wind speeds increase with height above the ground due to lack of friction.
Force of Surface Friction The effect of surface friction is to slow down the wind so that, near the ground, the wind crosses the isobars and blows toward lower pressure. This phenomenon at the surface produces an outflow of air around a high. Aloft, the winds blow parallel to the lines, usually in a wavy west-to-east pattern.
Estimating Wind Direction and Pressure Aloft by Watching Clouds Upper-level clouds moving from the southwest indicate isobars and winds aloft. When extended horizontally, the upper-level chart appears as in (c), where lower pressure is to the northwest and higher pressure is to the southeast.
Winds in the Southern Hemisphere blow around Highs and Lows opposite in direction than in the Northern Hemisphere.
Hydrostatic Balance Air does not rush off into space because the upward-directed pressure gradient force is nearly always exactly balanced by the downward force of gravity. When these two forces are in exact balance, the air is said to be in hydrostatic equilibrium or balance. When air is in hydrostatic balance, there is no net vertical force acting on it– no net vertical acceleration.
Determining Winds Wind is characterized by its direction, speed, and gustiness. An onshore wind blows from water to land. An offshore wind blows from land to water. A prevailing wind is the name given to wind direction most often observed during a given time period at a given location.
Wind direction can be expressed in degrees about a circle or as compass points.
These trees standing unprotected from the wind are often sculpted into “flag” trees.
A wind farm near Tehachapi Pass, California, generates electricity that is sold to Southern California