Managing Improvement (Quality in HE)
460 likes | 667 Vues
Managing Improvement (Quality in HE). External Assessment of Quality and Funding. The evolution of quality assurance in HE (1). 1986 & 1989 - Research Assessment Exercises (UGC) 1991 - Academic Audit (HEQC) 1992 - Research Assessment Exercise (UGC)

Managing Improvement (Quality in HE)
E N D
Presentation Transcript
The evolution of quality assurance in HE (1) • 1986 & 1989- Research Assessment Exercises (UGC) • 1991- Academic Audit (HEQC) • 1992- Research Assessment Exercise (UGC) • 1992- Further and Higher Education Act (removed binary line distinguishing polytechnics and universities and formed the four UK funding Councils – HEFCE for England) • 1993 - HESA established • 1993 to 1995 -Subject Review (v1) (HEQC)
The evolution of quality assurance in HE (2) • 1995 to 2001 -Subject Review (v2) (HEQC) • 1996- Research Assessment Exercise (HEFCE) • 1997- Quality Assurance Agency (QAA) founded • 1997 – Academic Infrastructure (QAA) • 1997 – Dearing Report • 1999 – Tuition Fees introduced (£1,000)
The evolution of quality assurance in HE (3) • 2001- Research Assessment Exercise (HEFCE) • 2002 to 2005 - Institutional Audits (QAA) • 2004- TQI Website launched • 2005 – National Student Survey (HEFCE) • 2006 - Tuition Fees Increased (up to £3,000) • 2007 - UNISTATS website (version 1) • 2008- Research Assessment Exercise (HEFCE)
The evolution of quality assurance in HE (4) • 2010/11 – Browne Review and resultant Government White Paper – “Putting Students at the Heart of Higher Education” • 2011 - Key Information Sets (HEFCE/HESA) • 2012 - Tuition Fees Increased (up to £9,000) • 2012 - UNISTATS website (version 2) • 2012 - Institutional Review & Quality Code (QAA) • 2013/14 – Higher Education Review (QAA) • 2013/14- Research Excellence Framework (HEFCE)
Administrative Cost/Effort: RAE • According to a report by the Higher Education and Policy Institute, the upper cost of RAE 2001 was calculated at £100M (using HEFCE methodology for calculating costs) • Likely to be vastly inflated value as many costs would be incurred anyway. • Direct costs estimated around £10M for the sector per exercise (averaged per annum this is just over £1M). • Differing opinions on whether this is a high cost or not.
Administrative Cost/Effort: QAA • Annual subscription rate for institutions, determined by student numbers. • In 2012/13, ranged from £2,575 - £50,000. LU cost would have been just over £34K. • In 2005, an article in the THES claimed that reforms to the QAA (ie replacing Institutional Auditswith Institutional Reviews) would halve the cost to the sector of complying with QAA audits from £20M to £10M.
Discussion Slide: Is it worth it? • What are the benefits of this type of assessment/public measure of quality? • Do the benefits justify the cost of administering the assessments? • Does this sort of review actually improve quality?
Discussion Slide: Is price an indicator of Quality? Car Chocolate Bar 100g Milk Chocolate Tesco – £0.30 Cadburys - £1.00 Green and Black’s - £2.00 Small 3 Door Model Kia - £7,795 Renault - £10,715 BMW - £17,775 PGT Degree UG Degree 1 Year Full-Time MBA Nottingham Trent – £15,000 Warwick- £33,000 Imperial College - £39,000 3 Year Full-Time BSc Maths Nottingham Trent – £9,000 Warwick- £9,000 Imperial College - £9,000
“What's measured, improves” Peter F. Drucker
League Tables • Range of League Tables • University Level vs Subject Level • Based mainly on statistical data (HESA returns) • Compiled using different criteria and criteria weighted differently • Are students using them to make decisions about where to study? • Are employers using them to make decisions about which graduates to employ? • Are staff using them to make decisions about where to work? • Are potential partners using them to make decisions about who to engage with?
National Student Survey • National Student Survey (NSS) introduced in 2005. • UG Students in their final year are surveyed by Ipsos-Mori on behalf of HEFCE. • Students getting a chance to rate the quality of their University experience. • Has increased in importance/influence over time. • Loughborough scored very well in the first survey.
League Tables and NSS • Loughborough’s position in these League Tables is thought to be directly linked to a change in NSS performance. • Demonstrates increasing importance in student opinion as a measure of quality. • Q22 “overall satisfaction” ranked for sector benchmarking.
LU NSS Performance and Quality of Student Experience • Has LU Student Experience actually decreased? • Or are other institutions “upping their game” or just “playing the game”? • Institutional response – closer focus on NSS. • PVCT progressing a number of initiatives. • Will these increase the quality of the student experience or just the NSS scores? • We still have a strong reputation for Student Experience. • 84% satisfaction still a good score. • Times Higher Education Student Experience Survey – LU has remained in the top 5 since its inception.
UNISTATS/Key Information Sets • UNISTATS/KIS (incorporating): • NSS results • Progression and withdrawal data • Entry tariff scores • Contact time • Assessment method data • Allows comparison of courses at different Universities • http://unistats.direct.gov.uk/your-unistats/shortlist/
KIS and contact hours • Quality measure/provision of information has directly impacted teaching policy at Loughborough. • Loughborough – introduction of minimum contact hours – direct response to KIS. • Competitive/bench-mark element. • Does this increase quality? • Or is this a case of relative (ie competitive) rather than absolute quality? • And is this a case of perceived (ie more contact hours = better quality) over actual quality?
Discussion Slide: Perception vs Actual • Do League Tables and other statistical measures reflect actual quality or a perception of quality? • What matters most? • How should the University respond to this?
An initial response to UNISTATS… Adapted from DarkWhite’s post on http://www.thestudentroom.co.uk Thread subject: The bumper thread of University League Tables discussion http://goo.gl/7OlNj
10 FOR EACH COURSE IT PRESENTS I’VE JUST COMPARED 90 COURSES ON UNISTATS IT SHOWS ME 5 COURSESPER PAGE DATA ITEMS
450 900 THAT’S A TOTAL OF… ITEMS OF DATA PER PAGE FOR ALL 10 PROGRAMMES!
THEN THERE’S WHICH? UNIVERSITY 25 250 THIS GIVES ME ANOTHER SET OF DATA ITEMS PER COURSE IN TOTAL!
An initial response to UNISTATS… ? HOW ON EARTH ARE WE SUPPOSED TO USE THIS DATA
University Strategy • Building Excellence • Strategic Drivers • Investing in our staff • Educating for success • Growing capacity and influence • Raising aspirations and standards • Ambitions • A distinctive international reputation forexcellence • A life-shaping student experience • Outstanding partnerships to deliver social, economic and cultural prosperity • A culture of delivering excellence in all that we do • One outstanding university: two vibrant campuses From “Missions and Value” Take pride in being the best we can be.
External Indicators of Quality • THE ‘Best Student Experience’ • Low withdrawal rates • Various awards • Excellent student support & facilities • Excellent student employability • Low complaint levels • Positive RAE outcomes • Positive staff survey results
Quality mechanisms at LU? In pairs: What quality mechanisms/measures currently exist at the University?
Quality mechanisms at the University Internal/External Audit Programme Boards External Examiners system Student Feedback Staff/Student Committees Statutory Returns/Statistical Indicators Complaints process/Office of Independent Adjudicator (OIA) • University Committees • Codes of Practice/Policies • Regulations • Academic Quality Procedures Handbook (AQPH) • Annual programmes & module approval process • Programme Review (APR & PPR) • Professional accreditation
Learning and Teaching Committee Responsible for: • The development and implementation of the University's Learning and Teaching Strategy • Policies and procedures for maintaining and enhancing qualityin learning and teaching
AQPH • Details policies and procedures which assure the quality and standards of teaching and learning • Translates QAA guidance into practice at LU ACADEMICINFRASTRUCTURE
Progs & modules approval/review process • Strategic Approval • Operational Approval • Annual Programme Review • Periodic Programme Review
University activities linked to quality LU initiatives Capital programme Student Charter Placements Contact time (KIS) • IT system developments • Responding to NSS issues • Staff survey results • Review of strategic plan
IT system developments Objectives Benefits More time to ‘add value’ Better management info Improved quality of service • Reduced manual input • Improved record keeping • Increased speed of response
Value for Money Programme Online re-registration
Value for Money Programme Electronic application processing
Measuring quality/improvement in your School/Service In pairs: What improvement/quality mechanisms/measures currently exist in your area of work? What else could you measure/review?
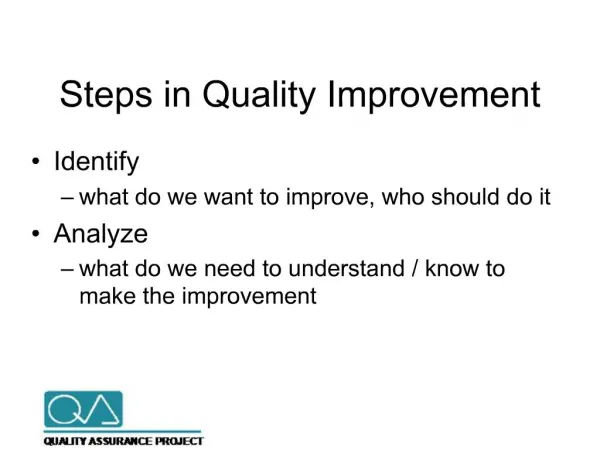
Managing Improvement – D.I.Y • Identify area for improvement • Know what improvement would look like • Understand the processes/product (inc impact on others) • Consult (need; other views; desired outcomes) • Consensus (where possible) • Assess cost/time of implementing changes • Prioritise • Develop, test, engage • Train, communicate • Evaluate success & quantify benefits • Where successful, tell people • Where unsuccessful, learn from the experience
Managing Improvement – D.I.Y And in the Real World….. • There isn’t time for everything • Choose your projects carefully • Quick wins (not the same as quick change) • Most impact for least effort • Choose what not to do • Make sure improvements don’t make things worse for others • Involve others – few areas where improvements in one area will work in isolation • You’ll need critical friends and broad shoulders • Sense of satisfaction when it works