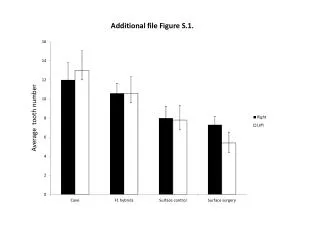
Measurement of Laccase Activity in Transplastomic Lines
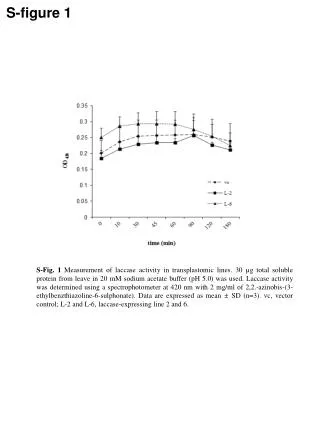
This study details the measurement of laccase enzyme activity in transplastomic lines using leaves with 30 µg of total soluble protein. The assay was conducted in a 20 mM sodium acetate buffer at pH 5.0. Laccase activity was assessed by spectrophotometry at 420 nm with 2 mg/ml of ABTS (2,2'-azinobis-(3-ethylbenzthiazoline-6-sulphonate)). The results are presented as mean ± SD with n=3. The analysis includes vector control (vc) and two laccase-expressing lines (L-2 and L-6).

Measurement of Laccase Activity in Transplastomic Lines
E N D
Presentation Transcript
S-figure 1 S-Fig. 1 Measurement of laccase activity in transplastomic lines. 30 µg total soluble protein from leave in 20 mM sodium acetate buffer (pH 5.0) was used. Laccase activity was determined using a spectrophotometer at 420 nm with 2 mg/ml of 2,2.-azinobis-(3-ethylbenzthiazoline-6-sulphonate). Data are expressed as mean ± SD (n=3). vc, vector control; L-2 and L-6, laccase-expressing line 2 and 6.