Forest Accounts
680 likes | 2.28k Vues
Forest Accounts. Outline. Outline. Why accounts? Land Accounts Forest Asset Accounts Supply and Use Accounts Suggest policy applications as we discuss the accounts. Why accounts?. Why accounts?. Apply accounting principles (stocks/flows).

Forest Accounts
E N D
Presentation Transcript
Outline Outline • Why accounts? • Land Accounts • Forest Asset Accounts • Supply and Use Accounts • Suggest policy applications as we discuss the accounts.
Why accounts? Why accounts? Apply accounting principles (stocks/flows) Comprehensive view (all forests, all timber, all uses and users) SEEA uses same classifications as SNA to link to economic statistics Consistent units of measure (hectares, m3, tonnes, currency) Consistent valuation methods Identify inconsistencies in data (coverage, errors, concepts)
Forest Accounts Forest accounts Timber(Volume, value) Timber, NTFP, Ecosystem services(Volume, value) • Subset of Land, Ecosystems, “Forestry” Assets Flows + other areas with timber resources National Balance Sheet SNA Benefits Non-SNA Benefits
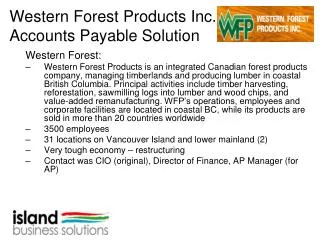
Forest Accounts It’s not all in one place! Source: World Bank. 2017. Forest Accounting Sourcebook. ? ? ? SNA = System of National Accounts: records economic production, investment and wealth SEEA-CF = System of Environmental-Economic Accounting: records assets and flows SEEA-AFF = Agriculture, Forestry and Fisheries: Industry focus on assets and flows SEEA-EEA = Experimental Ecosystem Accounting: records contribution of ecosystems
Forest Accounts Examples of forest-related SDG targets 6.6 By 2020, protect and restore water-related ecosystems, including mountains, forests, wetlands, rivers, aquifers and lakes 15.1 By 2020, ensure the conservation, restoration and sustainable use of terrestrial and inland freshwater ecosystems and their services, in particular forests, wetlands, mountains and drylands, in line with obligations under international agreements 15.2 By 2020, promote the implementation of sustainable management of all types of forests, halt deforestation, restore degraded forests and substantially increase afforestation and reforestation globally 15.3 By 2030, combat desertification, restore degraded land and soil, including land affected by desertification, drought and floods, and strive to achieve a land degradation-neutral world 15.B Mobilize significant resources from all sources and at all levels to finance sustainable forest management and provide adequate incentives to developing countries to advance such management, including for conservation and reforestation SEEA-CF - Forest accounts
Forest Accounts SEEA forest-related accounts SEEA Central Framework (SEEA-CF) SEEA Experimental Ecosystem Accounting (SEEA-EEA) Land Accounts Forest asset accounts Supply and use (physical and monetary) 5.13 Land Cover: Tree covered area (hectares) Land use: Land used for forestry (also other uses) (hectares) 5.16 Monetary asset account for land (currency units) 5.15 Physical asset account for forest and other wooded land (hectares) 5.19 Physical asset account for timber (cubic metres) 5.20 Monetary asset account for timber (currency units) • Supply and use (physical and monetary) • Marketed forest goods and services (in SNA) • Other forest goods and services (not in SNA)
1. Land Accounts 1. Land Accounts
1. Land Accounts 1. Land accounts • Land cover • Land use • Land value GlobeLand 3o, http://www.globallandcover.com/GLC30Download/index.aspx)
1. Land Accounts Scope and Purpose • Scope • land area of a country (including inland waters, coastal water bodies and intertidal areas). • Purpose • Put forests into context (% of total land area…) • Agreement on what exists on surface • Spatial infrastructure for administration (consistent names, classifications, overlay maps) • Good if based on National Spatial Data Infrastructure (NSDI) (total area, boundaries, shorelines, projections)
1. Land Accounts 5.13 Physical account for land cover Managed expansion/regression: increase/decrease in area of a land cover type due to human activity Natural expansion/regression: increase/decrease in area resulting from natural processes Reappraisals (upward or downward): changes due to updated information
1. Land Accounts Classifications = map legend Land cover classification (SEEA-CF, Table 5.12, p.178; and Annex p. 299) 1 Artificial surfaces (including urban and associated areas) 2 Herbaceous crops 3 Woody crops 4 Multiple or layered crops 5 Grassland 6 Tree-covered areas 7 Mangroves 8 Shrub-covered areas 9 Shrubs and/or herbaceous vegetation, aquatic or regularly flooded 10 Sparsely natural vegetated areas 11 Terrestrial barren land 12 Permanent snow and glaciers 13 Inland water bodies 14 Coastal water bodies and intertidal areas This class includes any geographical area dominated by natural tree plants with a cover of 10 per cent of more. Other types of plans (shrubs and/or herbs) can be present, even with a density higher than that of trees. Areas planted with trees for afforestation purposes and forest plantations are included in this class. This class includes areas seasonally or permanently flooded with freshwater. It excludes coastal mangroves (→07). 15 Marine SEEA-CF Land Accounting
1. Land Accounts Land cover change matrix (hectares) • Compares land cover maps over two periods of time • Consistent classifications, scales, methods, time of year • What has changed to what? • e.g., forest to crop • e.g., crop to artificial surfaces (urban) 2ha Crops to Artificial 2ha Grassland to Crops 3ha Tree covered to Crops
1. Land Accounts 5.14 Physical account for land cover Matching entry Beginning ofaccountingperiod Changed toCrop End ofaccountingperiod
1. Land Accounts Land use classification • How land is being used, managed or designated • Forest = cover; Forestry = use Land use classification (SEEA-CF, Table 5.11, p. 176; and Annex 1 p. 289) 1. Land 1.1 Agriculture 1.2 Forestry 1.3 Land used for aquaculture 1.4 Use of built-up and related areas 1.5 Land used for maintenance and restoration of environmental functions 1.6 Other uses of land n.e.c. 1.7 Land not in use! 2. Inland waters 2.1 Inland waters used for aquaculture or holding facilities 2.2 Inland waters used for maintenance and restoration of environmental functions 2.3 Other uses of inland waters n.e.c. 2.4 Inland waters not in use! 3. Coastal waters… 4. Exclusive economic Zone (EEZ)… 1.2.1 Forest land 1.2.1.1 Primary regenerated forest …
1. Land Accounts 5.16 Monetary asset account for land • Value of land by type of land use • Market value of land • Based on recent transactions (observed prices) • Also consider: land is a composite asset (includes soil, buildings, infrastructure, improvements, biological resources) • Changes in value due to changes in use, improvements, changes in quality…
1. Land Accounts 5.16 Monetary asset account for land Acquisition/Disposal = change in land use (e.g., purchase/sale between economic units) Revaluations = changes in price
1. Land Accounts Key policy considerations • Land cover • Agreement on what exists on surface of country • How and where this is changing (e.g., forests crop?) • Alignment of economic, environmental and social policies(e.g., where could timber harvesting have less impact?) • Forest as a % of national territory • Land use • Agreement on designated use(e.g., what activities are allowed and not allowed?) • Monetary asset account for land • Is land being properly valued? • Contribution to national wealth (increasing or decreasing?)
2. Forest asset accounts 2. Forest Asset Accounts
2. Forest asset accounts 2. Forest asset accounts • 5.15 Physical asset account for forest and other wooded land (hectares) • Subset of land accounts • 5.19 Physical asset account for timber (cubic metres) • Accounts for stock of exploitable timber • 5.20 Monetary asset account for timber (currency units) • Accounts for value of exploitable timber
2. Forest asset accounts It shows the opening and closing stock by area and changes in the area of forest and other wooded land 5.15 Physical asset account for forest and other wooded land
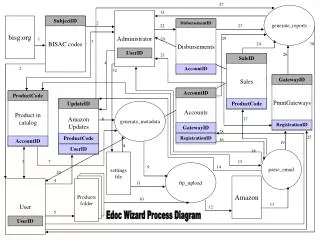
Planted forests • Other naturally regenerated forest • Primary forest Forest land • Other wooded land • Naturally regenerated forest 2. Forest asset accounts 5.15 Physical asset account for forest and other wooded land (hectares) • Clearly visible indications of human activities • Natural regeneration > 50% Land spanning more than 0.5 hectares Forest and other wooded land types Trees higher than 5 metres ‘Forest land’ definition Canopy cover of more than 10 %, or trees able to reach thresholds in situ OR a combined cover of shrubs, bushes and trees above 10% Y YY Y Y N(canopy 5-10%) Excludes tree-covered land used for agricultural or urban purposes Excludes tree-covered land used for agricultural or urban purposes Planting/seeding > 50% Not classified as forest land N Y N Y SEEA-CF - Forest accounts
2. Forest asset accounts 5.15 Physical asset account for forest and other wooded land (hectares) Reasons for additions and reductions
2. Forest asset accounts Scope and definition of timber resources Scope • Timber resources found in areas of forest and other wooded land (and other land, if of interest) Timber resources • Volume of trees, living or dead • Include all trees regardless of diameter, tops of stems, large branches and dead trees lying on the ground that can still be used for timber or fuel. Units of measure • Thousands of cubic meters over bark (before bark removed) Depletion of natural timber resources • Removals less sustainable yield (SY) • e.g., SY = 90; Removal = 100 depletion = 100-90 = 10
2. Forest asset accounts SEEA asset accounts is on the timber resources found in areas of forest and other wooded land, but depending on country circumstances, accounts might include other areas 5.19 Physical asset account for timber resources
2. Forest asset accounts 5.19 Physical asset account for timber resources • Reasons for additions and removals
4. Level 2 5.19 Physical asset account for timber resources Natural Growth • The gross annual increment, i.e., of all trees with no minimum diameter Reclassification Catastrophic losses • Increases / decreases in the area of forest land • Changes in management practice that shift timber resources from cultivated to natural or vice versa • Exceptional and significant losses of timber resources due to natural causes (e.g., fire) • Recorded only when there is no possibility that the timber resources can be removed Removals • Volume of timber resources removed from forest land, other wooded land and other land areas • Include removals of trees felled in earlier periods and the removal of trees killed or damaged by natural causes • Include fellings, silvicultural and pre-commercial thinnings and cleanings Falling residues • Rotten, damaged or in excess in terms of the size requirements • Excludes small branches that are also excluded from the scope of timber resources • Mortality from causes other than felling (e.g., diseases) • Insect attack, fire, or other physical damages Natural losses SEEA-CF - Water accounts
2. Forest asset accounts 5.20 Monetary asset account for timber • Contribution to national balance sheet (not GDP) • Monetary value of opening and closing stock of timber and changes in value over the accounting period • Based on volume of timber resources that can be harvested • Reflects changes in stock (+/-) but also changes in timber prices Two ways to set the price
2. Forest asset accounts 5.20 Monetary asset account for timber resources Reclassification = change in status cultivated natural Revaluations = changes in price
2. Forest asset accounts Key policy considerations • Physical asset account for forest and other wooded land (hectares) • Is forest area increasing or decreasing? • Economic dimension: fewer benefits in future. • Environmental dimension: ecosystems, flood control… • Social dimensions: population dependence on forests • Physical asset account for timber (cubic metres) • Is stock of timber being depleted? • Monetary asset account for timber (currency units) • What is contribution of timber to national wealth? • Do benefits of harvesting justify the costs(e.g., concession prices)?
Group exercise Group exercise
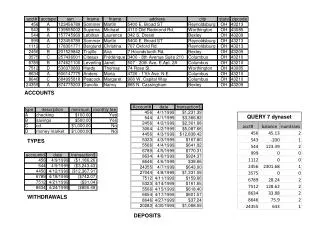
Group exercise Situation • Have 5 years of historical data on forest area, deforestation and natural regression • Need to model afforestation, natural expansion, opening and closing stock • Need to produce SDG 15.1.1 forest area as a proportion of total land area • Objective (Groups of 3-5 persons; 20min to prepare) • Calculate afforestation, natural expansion, closing stock, opening stock for each year • Calculate SDG indicator 15.1.1 for 5 years • Report & discuss answers (10min)
Group exercise Step 1 • Calculate afforestation, natural expansion, opening stock and closing stock for years 2 to 5 • Opening stock for Year 2 is Closing stock for Year 1… • Afforestation increases 5% more from previous year (if Y1=100, Y2=105) • Natural expansion is 2% of Opening stock (if OS=100, NE=2) SEEA-CF - Forest accounts
Group exercise Step 2 • Calculate • SDG indicator 15.1.1 forest area as a proportion of total land area • (Forest area/Total land area)*100 • Total land area = 30,000,000 hectares • Use Closing stock of forest area • Calculate for 5 years
Group exercise Group exercise • Is everyone clear on the objectives? • 20 minutes group work • Please ask questions • Results: • Report SDG indicator 15.1.1
Group exercise The answers
3. Physical and monetary flows 3. Physical and Monetary Flows
3. Physical and monetary flows Physical and monetary flows • Timber is only one product (= goods and services) • Other marketed goods (fuelwood, NTFP) • Non-market ecosystem services • Regulating and maintenance: flood control, habitat, • Cultural: recreation, scientific, spiritual SNA SEEA-CF SEEA-EEA Defines Material Flow Accounts Defines Ecosystem Services Defines Monetary flows of Forest products Includes marketed forest products (provisioning services) Physical and monetary supply and use of marketed products Attributed to supplying sector (usually Forestry industry)
3. Physical and monetary flows Physical and monetary supply and use Forest Industry + Imports supply Lumber to “Other” + Residuals Total Supply = Total Use Other + Imports supplies Furniture to Households and Exports (+Residuals) Environment Supplies Timber to Forest Industry Based on SEEA-CF Material Flows • Physical and monetary supply and use (marketed)
3. Physical and monetary flows Physical and monetary flows • Monetary flows already in SNA • Value of timber harvested by timber industry • Value of lumber sold and imports (to furniture industry) • Value of furniture sold and imports to households and exports • Physical flow accounts • Include flows from the environment (natural inputs) • Include flows to the environment (residuals) • Can be estimated from price/volume (e.g., $/tonne of lumber)
3. Physical and monetary flows Ecosystem services • Can be valued, but not all within SNA; Why? • SNA records market exchanges between economic units • Important to measure in physical terms first • Can apply valuation methods appropriate to purpose SNA Benefits Non-SNA Benefits e.g., water regulation, air purification, carbon sequestration, spiritual e.g., timber, NTFP • Not produced by economic units • Not bought and sold on market • Still very important to human well-being (health, stable climate, clean air, lower risk from extreme events, exposure to nature…) • Produced by economic units • Potential to be bought and sold on market • Value in terms of potential market value
3. Physical and monetary flows A note on valuation of ecosystem services • SNA Benefits • Should be in SNA • Benefits produced by economic units • Potential to be marketed • If require capital, labour…(e.g., timber) • Value ecosystem’s contribution (rent) • If no capital, labour…(e.g., wild food) • Value at market price • Correct for undercounting in SNA • Non-SNA Benefits • Should NOT be in SNA • Produced by ecosystems (e.g., water regulation, pollination, air purification) • NO potential to be marketed • Better to have reliable physical measures • View as part of national wealth • Demonstrate “importance” to well-being Source: CICES, 2013. www.cices.eu Ecosystems & the Ocean
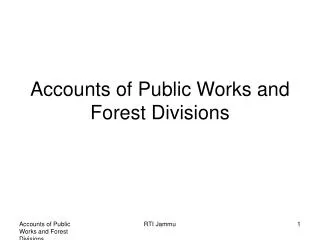
3. Physical and monetary flows Ethiopia: forest valuation Forest products in other sectors: 6.7% of GDP Undercounting 2.3% of GDP Based on market and non-market values: • Provisioning goods and services • Timber products • Firewood/charcoal • Non-timber forest products • Regulating services • Carbon sequestration • Pollination • Water flow control • Soil erosion control • Reservoir sedimentation control • Cultural and recreational services • Protected-area tourism • Trophy hunting • Non-use benefits Non-market benefits small… but incomplete
3. Physical and monetary flows Which ecosystems provide which services? Tree covered areas • Provisioning • Nutrition • Food, Drinking water • Materials • Biomass, Water • Energy • Biomass • Regulation & Maintenance • Mediation of wastes, toxics… • Mediation of flows (mass, water…) • Maintenance of physical, chemical and biological conditions • Carbon sequestration • Cultural • Physical • Intellectual • Spiritual Source: Bordt, 2017
3. Physical and monetary flows Physical and monetary flows • Example (services in physical units) Note: Units of measure are very different → Hard to add up to total amount OR compare them Source: Remme et al., 2014 (Limburg, the Netherlands)
3. Physical and monetary flows Non-market valuation approaches • Revealed preference: • Production function: (resource rent) • value = f(ecosystem, produced capital, labour) • Replacement cost: produce service with another ecosystem/asset • Hedonic pricing: real-estate prices, wages relative to distance • Averting behaviour: expenditures to avoid degradation • Travel cost: expenditures to enjoy a service (e.g., recreation) • Stated preference: • Contingent valuation, choice modelling: willingness to pay • Simulated exchange values: model supply/demand • Payments for ecosystem services (PES): • Carbon, biodiversity markets • Rehabilitation costs: Payments made to improve condition
3. Physical and monetary flows Measurement challenges • More challenging for Regulating and Cultural Services • How to measure monetary value of regulating services? • Spatial dependencies (downstream, species/habitat) • Multiple beneficiaries • Risks (e.g., flood control, climate regulation) • Non-linear responses • Thresholds/resilience, climate change, refuge areas • Aggregating values of different services • Services can be competing, complementary or independent • Transferring measured values from one site to another • Benefits/function transfer sites need to be similar • Highly dependent on decision context • Project assessment: trade-offs • Long-term sustainable use of ecosystems: high-level indicators • Payments and compensation: needs to have precise values
3. Physical and monetary flows Key policy considerations • The “true” economic value of forests: • What is the full economic value of forests, including non-market values, and who are the beneficiaries? • Is economic growth based on the depletion of forests? What is the [long-term social] cost of deforestation? • Are policy decisions based on the total economic value of forests, taking into account linkages throughout the economy and impacts on all stakeholders? • The impact on forests of non-forestry policies: • What are the economic trade-offs among competing sectors or optimizing forest ecosystems that produce benefits to multiple stakeholders? • How will economic growth, macroeconomic and other policies affect forests? Source: Lange, 2003. in FAO, 2003. Cross-sectoral policy impacts between forestry and other sectors
Take home points Take home points • Accounts harmonize & validate statistics • Land Cover Account defines “Tree covered area” • Land Use defines land designated for Forestry • Asset Account for Forest Land is a subset of Land Cover • Area and value • Asset Account for Timber includes all exploitable timber • Volume and value • Forests are ecosystems, providing timber, NTFP, Regulating & Maintenance and Cultural Services • Opportunity to assess trade-offs between economic, environmental and social policies
Discussion Forest accounts • Other possible topics • Expenditures on protection, management • Social forestry (small operators, communities as beneficiaries) • Improving carbon accounts • Discussion • What are the policy priorities? • Which accounts should be addressed first? • Which accounts are more feasible (data, capacity, …)?