
Introduction
↑ Snowmelt Rate Overland. Hydrologic response to modeled snowmelt input in alpine catchments in Southwestern United States. ↓ Snowmelt Rate Stored. Jessica M. Driscoll 1 , Thomas Meixner 1 , Steven M. Jepsen 2 , Noah P. Molotch 2 , Mark W. Williams 2 , James O. Sickman 3

Introduction
E N D
Presentation Transcript
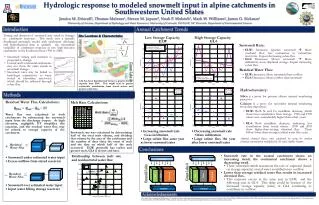
↑ Snowmelt Rate Overland Hydrologic response to modeled snowmelt input in alpine catchments in Southwestern United States ↓ Snowmelt Rate Stored Jessica M. Driscoll1, Thomas Meixner1, Steven M. Jepsen2, Noah P. Molotch2, Mark W. Williams2, James O. Sickman3 1University of Arizona, Department of Hydrology and Water Resources; 2University of Colorado, INSTAAR; 3UC Riverside, Department of Environmental Sciences Introduction Annual Catchment Trends y = 0.0022x + 0.0072 R2 = 0.3643 Timing and duration of snowmelt may result in changes in catchment response. This study uses a spatially distributed snowmelt model with catchment discharge and hydrochemical data to quantify the interannual variability of catchment response in two high-elevation catchments in the Southwest from 1996 to 2006. Site Locations & Characteristics High Storage Capacity GL4 Low Storage Capacity ELW Snowmelt Rate: ELW: Increases; Quicker snowmelt More overland flow, less connection to subsurface reservoirs. Expect decreasing solute flux. GL4: Decreases; Slower snowmelt More infiltration, more displaced storage. Expect increasing solute flux. Residual Water Flux: ELW: Increases; More snowmelt than outflow. GL4: Decreases; More outflow than snowmelt y = 0.0056x + 0.004 R2 = 0.6263 Snowmelt timing and duration is projected to change. Coastal and Continental catchments may not show the same trends in snowmelt change. Snowmelt rates may be linked to hydrologic connectivity to water stored in subsurface reservoirs, which should be reflected through solute flux. GL4 has been hypothesized to have a greater storage capacity than ELW. This might lead to greater volumetric contribution from stored waters and greater solute flux. Hydrochemistry: Silica is a proxy for primary silicate mineral weathering processes. Calcium is a proxy for secondary mineral weathering from dust deposition. ELW: Both Si and Ca trendlines decrease, which shows less contribution from storage. 1996 and 1999 values were considerably higher than other years. GL4: Both trendlines decrease, indicating less contribution from stored waters. 2000 and 2003 show higher-than-average chemical flux. These follow lower-than-average residual water flux years. Annual chemical fluxes were calculated by using the median chemical concentration multiplied by the total outflow volume. Methods Total area: 2.2 km2 Residual Water Flux Calculations: Melt Rate Calculations: Green Lake 4 Faster, Earlier Water flux was calculated in both catchments by subtracting the snowmelt input from the discharge output. At high elevation, negligible ET simplifies this equation, and the residual water flux may be related to storage capacity of the catchment. Total area: 1.2 km2 Slower, Later Snowmelt Emerald Lake • Increasing snowmelt rate • Less infiltration • Large solute flux same year as lower snowmelt rates • Decreasing snowmelt rate • More infiltration • Large solute flux the year after lower snowmelt rates Snowmelt rate was calculated by determining half of the total melt volume, and dividing that volume by the area of the catchment and the number of days since the onset of melt and the date on which half of the melt occurred. ELW generally has earlier and greater melt, GL4 is slower and later. Infiltration Overland Outflow – Storage = Snowmelt Residual Water Flux + Conclusions Snowpack Snowpack Outflow Relationship between melt rate and residual total water flux: • Snowmelt rate in the coastal catchment shows an increasing trend; the continental catchment shows a decreasing trend. • These snowmelt trends accentuate the role of expected (based on storage capacity) stored water contribution to outflow. • Lower than average residual water flux results in increased chemical flux. • This response occurs in the same year in ELW, and the following year in GL4. This delay could be because of the increased storage capacity (talus) in GL4 continuing to contribute to outflow. Snowmelt under estimated water input Excess outflow from stored reservoir Bedrock Talus Bedrock Soil Soil Snowmelt Talus Green Lake 4 – = – Residual Water Flux Emerald Lake Outflow Snowmelt over estimated water input Input water filling storage reservoir Outflow Outflow Acknowledgements We would like to thank the University of Colorado for data collection and management in the Green Lakes Valley via the Niwot Ridge LTER and Boulder Creek CZO, and the University of Riverside for data in the Tokopah Basin. This project has been funded by NSF DEB #0423662. Please direct questions about this poster to Jessica Driscoll via email jmd@email.arizona.edu.


