Download
1 / 78
800 likes | 974 Vues
Data Visualization and Graphic Design Andrew Rundle, Dr.P.H . Allan Just, M.Phil . Introductions. Andrew Rundle, Dr.P.H . Associate Professor of Epidemiology. Studied 3D computer graphics at the Fu Foundation School of Engineering. Studied at the Art Students’ League.

E N D
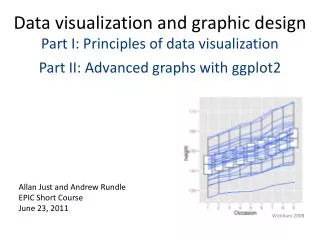
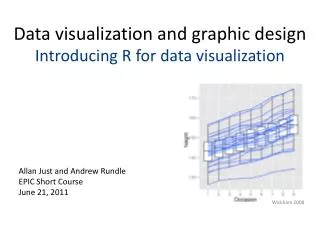
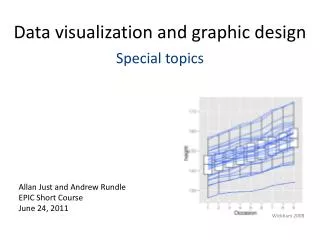
Data Visualization and Graphic Design Andrew Rundle, Dr.P.H. Allan Just, M.Phil.
Introductions • Andrew Rundle, Dr.P.H. • Associate Professor of Epidemiology. • Studied 3D computer graphics at the Fu Foundation School of Engineering. • Studied at the Art Students’ League. • Art Credits: Science, National University, School of Design and Architecture (Argentina), La Jolla Museum of Contemporary Art, 555 Gallery (Detroit), M&A (Los Angeles), Universidad Del Claustro De Sor Juana (Mexico City), PBS. • Opinionated regarding PowerPoint.
Introductions • Allan Just, M.Phil. • 4th Year Ph.D. Candidate in Environmental Health Sciences. • Has studied the use of R for applied statistics and data visualization since 2007. • Led a graduate Introduction to R workshop and departmental seminars on Exploratory Data Graphics and Principles of Scientific Data Visualization. • Is frequently asked for help with R code.
Course Objectives • Provide a framework for thinking about graphic design, illustration and data visualization as part of career development and success. • Provide you with the tools needed to produce: • High quality PowerPoint presentations • Illustrations for journal articles, presentations and posters • Data visualizations and graphs
Graphic Design as Part of Career Development • Effective presentations are remembered by audiences and conference planners. • Increases likelihood of subsequent speaking invitations. • Effective slides generate – “Can I use your slide on…” requests. • Slides that effectively illustrate theories, paradigms or ideas become an important vehicle through which the idea is discussed.
Biomarker Continuum Exposure Disease Internal Dose Cotinine, DDE Molecular Dose DNA-, protein- adducts Biological Effect Mutated oncogenes/ tumor suppressor genes Susceptibility Genetic polymorphisms, nutrition, DNA repair [Perera& Weinstein, 1982]
Graphic Design as Part of Career Development • For commentary, review, and theoretical papers, journal editors often request figures. • Makes the paper more ‘citable’. • Several journals now package figures from papers as downloadable PowerPoint slides. • The re-use of your figures/illustrations increases your profile and hopefully the citation rate of the original paper.
Graphic Design as Part of Career Development NCBI is setting up an image search system similar to Pubmed.
Downloads In a web browser go to: http://www.columbia.edu/~agr3/EPIC/
Basic Concepts in Computer Graphics
Raster Graphics • Also known as bitmaps, they are grids of colored points called pixels. • Described by the height and width of the image in pixels and the number of bits of color information per pixel. • Image quality is resolution dependent and images cannot be scaled up without loss of image quality. • Raster images are generated by digital cameras and software like Photoshop.
Raster Graphics: File Formats • Graphic Interchange Format (GIF) • One of the earliest image files on the Internet (CompuServe 1987). • Can display 256 colors, transparent pixels and animations. • Good for logos and images with areas of solid color. • Not a good format for photos.
Raster Graphics: File Formats • Joint Photographic Expert Group (JPEG) • Defines an approach to ‘lossy’ image compression. Every time the image is recompressed information is lost. • The most common image format on the Web, the standard was approved in 1992. • Best for photos with smooth variations of tone and color, supports millions of colors. • Not suited for line drawings and other textual or iconic graphics.
Raster Graphics: File Formats • Portable Network Graphics (PNG) • Developed due to patent issues with GIF. • Uses lossless image compression. • Supports millions of colors. • Full and partial transparency. • Larger file size than JPG. • Equivalent in quality to JPG for photos. • Better than JPG for text, line art or graphics.
Vector Graphics • Uses geometrical primitives such as points, lines, curves, and shapes to represent images. • Primitives are defined using equations. • Can scale indefinitely to any resolution. • Transformations such as rotate, mirror, stretch and skew are easy to apply. • Smaller file sizes than raster images. • Converting vector to raster is easy, but going the opposite direction is difficult.
Vector Graphics Loin Leg, Ham Spare Ribs Belly
PowerPoint • Primarily a vector based layout and illustration tool. • Text boxes, primitives, word art, graphs, within slide animation and between slide transitions. • Works as flip-book or deck of cards. • Can import raster images and perform some editing functions. • Can export combined vector and raster compositions to raster.
Hell's Kitchen N.Y.C.
GNU Image Manipulation Program (GIMP) • An open-source raster editing program. • Has the functionality of Adobe Photoshop. • We’ll use GIMP to: • Resize and compress images • Crop images • Clean images • Make transparent areas • Layer images
Background Choices • Select a background that provides contrast to your text and illustrations.
Design Elements: Text Boxes Text Boxes
Fonts • My primary objective for font selection is readability from the back of the room. • Squint test: squint at your monitor, if you can still read the text, the font is probably fine. Font Test at 24 point. Arial Black Font Test at 24 point. Arial Font Test at 24 point. Verdana Font Test at 24 point. Gils Sans MT Font Test at 24 point. Times New Roman
Fonts: Point Size Arial Black 24 Arial Black 20 Arial Black 18 Arial 24 Arial 20 Arial 18 Verdana 24 Verdana 20 Verdana 18 Times New Roman 24 Times New Roman 20 Time New Roman 18 Gills Sans MT 24 Gills Sans MT 20 Gills Sana MT 18
Fonts: Serifs, Widths and Stroke Serifs AAaa BBbb CCcc Width S S Stroke
Design Elements: Text Boxes Text Boxes
Colors • PowerPoint uses Red, Green, Blue (RGB) additive color model. • R, B and G are added together to make a wide array of colors. • Each primary color can have a value from 0 to 255, known as 8 bit color, for a total of 16.7 million possible colors. 1 bit color 8 bit color 24 bit color
A little Bit of Color Theory • The eye is sensitive to differences in color, but don’t forget contrast. • Visually, warm colors come forward, cool colors recede. 255, 0, 0 51, 153, 255 0, 0, 255 255, 51, 153
Adjusted1 Mean BMI by Gender and Race/Ethnicity Adjusted BMI • Adjusted for age and education Men Women
Adjusted1 Mean BMI by Gender and Race/Ethnicity Adjusted BMI • Adjusted for age and education Men Women
Design Elements: Text Boxes Text Boxes
Design Elements: Text Boxes Text Boxes
Design Elements: Text Boxes • Text Boxes • Second line • Third line
Try to Make these Primitives Text Box
Design Elements: Images • Images can be added in two ways: • As an inserted image element, • As a texture-map filling a primitive. • Images can be cropped and scaled. • The color balance, contrast and brightness can be altered. • Colors can be set to transparent.