
Pairwise Linkage Disequilibrium Analysis of SNPs in T2D: Insights from KCNJ11 and ABCC8
This study investigates the pairwise linkage disequilibrium (LD) of 31 SNPs located within a 211.3-kb genomic region containing the KCNJ11 and ABCC8 genes, along with neighboring genes NUCB2 and DKFZp686I21167. Using genotype data from 893 control and 909 type 2 diabetes (T2D) subjects, we visualize r² values using the GOLD program. Our results highlight significant LD patterns, particularly for 8 SNPs showing strong allelic associations with T2D, emphasizing the genetic complexity of diabetes susceptibility in this locus.

Pairwise Linkage Disequilibrium Analysis of SNPs in T2D: Insights from KCNJ11 and ABCC8
E N D
Presentation Transcript
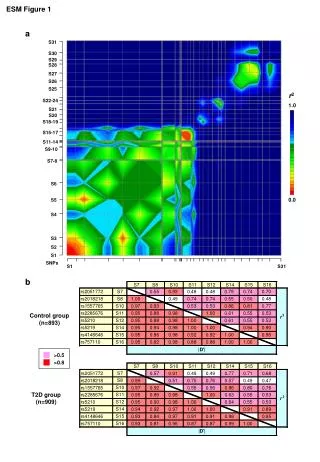
>0.5 >0.8 ESM Figure 1 a S31 S30 S29 S28 S27 S26 S25 r2 S22-24 1.0 S21 S20 S18-19 S15-17 S11-14 S9-10 S7-8 S6 0.0 S5 S4 S3 S2 S1 SNPs S1 S31 b Control group (n=893) T2D group (n=909)
ESM Figure 1 • Pairwise LD of 31 SNPs from the 211.3-kb genomic region containing KCNJ11, ABCC8 and neighboring known genes NUCB2 and DKFZp686I21167 (hypothetical gene). SNP numbers correspond to ID numbers in Table 1. Color-coded r2 values for pairs of SNPs are plotted using the GOLD program, with scores of 1 (shown in red) and 0 (in dark blue). • (b) LD patterns for 8 SNPs showing significant allelic association with T2D by the single-locus test. Pairwise LDs were measured by |D’| (lower left) and r2 (upper right) using genotype data obtained from 893 control subjects or 909 T2D subjects. Pink or red squares shaded indicate significant LD: pink for (|D’| or r2)>0.5 and red for (|D’| or r2)>0.8.