Download
1 / 17
170 likes | 389 Vues
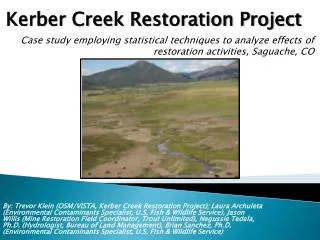
Kama Creek Restoration Project Update. Case Study: Kama Creek. - Kama Creek in the Nipigon Bay historically significant habitat for Coaster Brook Trout. - In the 1960’s stream was diverted from its original channel (realigned) - Loss of approximately 600 m of brook trout habitat (MNR, 2001)

E N D
Case Study: Kama Creek • - Kama Creek in the Nipigon Bay historically significant habitat for Coaster Brook Trout. • - In the 1960’s stream was diverted from its original channel (realigned) • - Loss of approximately 600 m of brook trout habitat (MNR, 2001) reposition and reroute the current delta and channel of Kama Creek riffle-pool or cascade-pool system to further enhance fish passage.
Construction • The rehabilitation design for this site included the reinstatement of Kama Creek and its floodplain to a condition resembling its original configuration. This was achieved by repositioning and re-routing the current delta and channel in Kama Creek in order to increase sinuosity, provide a natural floodplain, and increase instream variability
Objectives • determine the parameters that are most important to improving coaster brook trout habitat • establish a methodology or set of baseline conditions for the existing Kama Creek, Nipigon restoration project • address how it should be monitored in the future
Pre and Post-Construction Inventory and Monitoring • Focus was placed on reach 1. the straightened portion of the stream running from the culvert at the railway to the delta at Lake Superior • Monitoring was performed on a weekly basis in 2011, a biweekly basis in 2012 and a monthly basis in 2013 May to November.
Substrate: Pebble counts were performed to characterize channel substrate, estimate channel roughness, and assess sediment transport characteristics of the stream using methods by Wolman (1954). Each reach measured shows a high averagepercent of small gravel consistent with spawning habitat. Figure 1. Historgram for pebble count performed on Kama Creek reach 1 and 2 in 2011.
Embeddedness • embeddeddnessis the extent to which rocks (gravel, cobbles, and boulders) are sunken into the silt, sand, or mud of the stream bottom (Simonson et al. 1994). The following table outlines the relationship between percent embeddedness and habitat quality Percent embeddedness Habitat quality < 25% embeddednesssomewhat embedded Excellent Conditions 25 - 50% embeddednesshalfway embedded Good Conditions 50 - 75% embeddednessmostly embedded Fair Conditions > 75% embeddednesscompletely embedded Poor Conditions • The embeddedness for Kama Creek reach 1 and 2 both fell in the low to moderate range between 25-50% which represents good to excellent conditions.
Fish Data - Fisheries data was collected by electrofishing a portion of each treatment Reach once in June and once in August 2011
Water Temperature Table 3. Average Monthly Temperature for Kama Creek.
Discharge Discharge was measured in the stream on a weekly basis from May 2011 to October 2011 and June to November in 2012.
Habitat assessment The total score for habitat was 0.67 which falls in the suboptimal range condition A Habitat assessment was performed and habitat parameters were evaluated and rated on a scale of 0-20, 20 being optimal conditions and 0 being poor conditions. Table 3. Assessment Score Range .
Future Monitoring • Benthos • Substrate • Fish • Groundwater • Habitat Assessment
Holl K.D., Krone E.E. & Schultz C.B. (2003) Landscape restoration: moving from generalities to methodologies. BioScience, 53, 491–502. Kauffman, J. B., Beschta R.L., Otting, N. and Lytjen D. 1997. An Ecological perspective of riparian and stream restoration in the Western United States. Fisheries. 22: 12-24. May, C. W., E. B. Welch, R. R. Horner, J. R. Karr, and B. W. Mar. 1997. Quality indices for urbanization effects in Puget Sound lowland streams. Water Resources Series Technical Report No. 154. Urban Water Resources Center, Department of Civil Engineering, University of Washington, Seattle, Washington. Purcell, A.H., Friedrich, C., Resh, V.H. 2002. An Assessment of a Small Urban Stream Restoration Project in Northern California. Restoration Ecology. 10: 685-694. Woolsey, S., Capelli, F., Gonser, T., Hoehn, E., Hostman, M., Junker, B., Paetzold, A., Roulier, C., Schweizer, S., Tiegs, S.D., Tockner, K., Weber C., and Peter, R. 2007. A strategy to assess river restoration success. Freshwater Biology. 52: 752-769. KEY REFERENCES QUESTIONS?