Download
1 / 27
290 likes | 982 Vues
Methods of Measuring Crime. Uniform Crime Reports. Self- Report Surveys. Victim Surveys. Based on Crimes Reported to the Police. Based on a population unit of 100,000 people. Divided into two representative categories: Indexed and non-Indexed. Reported for U.S., Cities, and SMSA’s.

E N D
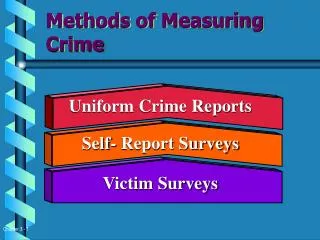
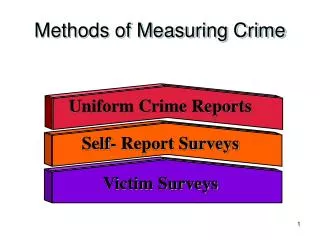
Methods of Measuring Crime Uniform Crime Reports Self- Report Surveys Victim Surveys
Based on Crimes Reported to the Police Based on a population unit of 100,000 people Divided into two representative categories: Indexed and non-Indexed Reported for U.S., Cities, and SMSA’s Crimes known / Arrest = Clearance Rate Uniform Crime Reports
Part I “Index” Crimes Criminal Homicide Forcible Rape Robbery Aggravated assault Burglary Larceny/theft Motor vehicle theft Arson Part II Crimes All others except traffic Violent Crime Non-violent Crime Uniform Crime Reports
Cannot capture the “dark figure” of crime Methodological Hiccups Criticisms and Limitations of the UCR • Counting Rule • Reporting Practices • Attempted vs. Completed Crimes
The Future of the Uniform Crime Reports • National Incident-Based Reporting System (NIBRS) • Maintained by the F.B.I. • Twenty-two crime categories • More information on each crime in each category • Data compiled based on incidents, not arrests.
Self-Report Surveys • Participants (usually juveniles) reveal information about their violations of the law Advantages • Get at “Dark Figure of Crime” • “Victimless Crimes” • Compare to “official data” • Measure theoretical concepts and connect with criminal behavior
Self-Report Surveys • Disadvantages • May underestimate “chronic offenders” • People Can Lie • Survey Methodology Problems • Seriousness of Offense
National Crime Victimization Survey 1. Asks victims about their encounters with criminals 2. Nationally representative sample 3. May also describe people most at risk 4. Limitations: Little information about offenders Cannot assess some crimes Limitations of Survey Research
REVIEW • UCR • Aggregate Data, Crimes known to police • Self-report • Individual level data, links offender characteristics to criminal offending • NCVS • Aggregate Data, victimizations
Crime Trends and Correlates of Crime • Crime Trends • Is crime increasing, decreasing or stable? • Why? • Correlates of Crime • What factors are related to crime? • Geographic location, Age, Race, Gender, Social Class?
Crime Trends • UCR and NCVS data reveal a recent steady decrease in violent crime. • The decrease is being driven by a sharp decline in violent crime among juveniles. • NCVS indicates a long term trend of decreasing property crime
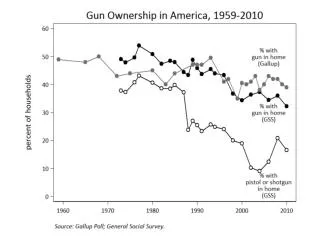
Age Composition The Economy Social malaise Guns—Availability Justice Policy—Police or Prisons? Explaining Crime Trends
Social Class and Crime • Official statistics reveal a strong class-crime relationship. • Lower Social Class more crime prone? • Criminal Justice System bias against the lower class? (More likely to arrest/prosecute?)
GENDER AND CRIME • UCR, NCVS, and SR data all indicate that females are more likely than males to commit criminal acts • Chivalry hypothesis? • Socialization? • Biological differences? • Feminist explanations
RACE AND CRIME • Similar dilemma as social class • SRweak if any relationship • Officialstrong relationship • BUT, NCVS data! • Is relationship due to bias? • How police patrol and interact with minorities • Disparity in how CJS processes minorities? • If relationship is “true,” why? • Relationship to class, neighborhood, culture.
AGE AND CRIME Problems with the age crime curve: Arrests only Aggregate data
Longitudinal Birth Cohort Research Research that tracks an identifiable group of individuals over a long period of time.
The “Chronic 6%” After following a birth cohort of 9,945 boys born in Philadelphia in 1945, Wolfgang and his associates found that 6% of the total sample were responsible for 51.9% of all offenses. These were referred to as chronic offendersor career criminals. Similar research has resulted in similar findings.
Continuity of Crime The cohort follow-ups clearly show that most chronic juvenile offenders continue their law-violating careers as adults. Then and ………….. NOW
Implications of Continuity If the “Onset” of offending occurs in childhood for some kids, you must start your explanation at that point. Why do some kids begin their offending in adolescence?