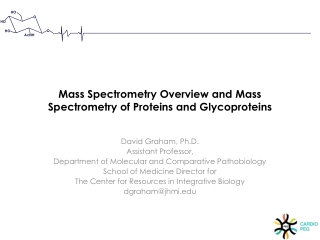
Mass Spectrometry for Protein Quantification and Identification of Posttranslational Modifications
Mass Spectrometry for Protein Quantification and Identification of Posttranslational Modifications. Joseph A. Loo Department of Biological Chemistry David Geffen School of Medicine Department of Chemistry and Biochemistry University of California Los Angeles, CA USA. protein-ligand

Mass Spectrometry for Protein Quantification and Identification of Posttranslational Modifications
E N D
Presentation Transcript
Mass Spectrometry for Protein Quantification and Identification of Posttranslational Modifications Joseph A. Loo Department of Biological Chemistry David Geffen School of Medicine Department of Chemistry and Biochemistry University of California Los Angeles, CA USA
protein-ligand interactions protein complexes (machines) post-translational modified proteins protein families (activity or structural) Proteomics and posttranslational modifications Eukaryotic cell. Examples of protein properties are shown, including the interaction of proteins and protein modifications. Patterson and Aebersold, Nature Genetics (supp.), 33, 311 (2003)
Proteomic Analysis of Post-translational Modifications • Post-translational modifications (PTMs) • Covalent processing events that change the properties of a protein • proteolytic cleavage • addition of a modifying group to one or more amino acids • Determine its activity state, localization, turnover, interactions with other proteins • Mass spectrometry and other biophysical methods can be used to determine and localize potential PTMs • However, PTMs are still challenging aspects of proteomics with current methodologies
Complexity of the Proteome • Protein processing and modification comprise an important third dimension of information, beyond those of DNA sequence and protein sequence. • Complexity of the human proteome is far beyond the more than 30,000 human genes. • The thousands of component proteins of a cell and their post-translational modifications may change with the cell cycle, environmental conditions, developmental stage, and metabolic state. • Proteomic approaches that advance beyond identifying proteins to elucidating their post-translational modifications are needed.
Use MS to determine PTM of isolated protein • Enzymatic or chemical degradation of modified protein • HPLC separation of peptides • MALDI and/or ESI used to identify PTM • MS/MS used to determine location of PTM(s)
Proteomic analysis of PTMs Mann and Jensen, Nature Biotech. 21, 255 (2003)
Glycoprotein Gel Stain Detection of glycoproteins and total protein on an SDS-polyacrylamide gel using the Pro-Q Fuchsia Glycoprotein Gel Stain Kit. CandyCane glycoprotein molecular weight standards containing alternating glycosylated and nonglycosylated proteins were electrophoresed through a 13% polyacrylamide gel. After separation, the gel was stained with SYPRO Ruby protein gel stain to detect all eight marker proteins (left). Subsequently, the gel was stained by the standard periodic acid–Schiff base (PAS) method in the Pro-Q Fuchsia Glycoprotein Gel Stain Kit to detect the glycoproteins alpha2-macroglobulin, glucose oxidase, alpha1-glycoprotein and avidin. Pro-Q™ Glycoprotein Stain (DDAO phosphate) Molecular Formula: C15H18Cl2N3O5P (MW 422.20)
Nitro-Tyrosine Modification • Oxidative modification of amino acid side chains include methionine oxidation to the corresponding sulfone, S-nitrosation or S-nitrosoglutationylation of cysteine residues, and tyrosine modification to yield o,o’-dityrosine, 3-nitrotyrosine and 3-chlorotyrosine. • Nitric oxide (NO) synthases provide the biological precursor for nitrating agents that perform this modification in vivo. NO can form nitrating agents in a number of ways including reacting with superoxide to make peroxynitrite (HOONO) and through enzymatic oxidation of nitrite to generate NO·2 • Tyrosine nitration is a well-established protein modification that occurs in disease states associated with oxidative stress and increased nitric oxide synthase activity. • The combination of 2D-PAGE, western blotting, and mass spectrometry has been the more typical strategy to identify 3-nitrotyrosine-modified proteins.
Nitro-Tyrosine Modification “Proteomic method identifies proteins nitrated in vivo during inflammatory challenge,” K. S. Aulak, M. Miyagi, L. Yan, K. A. West, D. Massillon, J. W. Crabb, and D. J. Stuehr, Proc. Natl. Acad. Sci. USA 2001; 98: 12056-12061. Anti-nitrotyrosine immunopositive proteins in lung of rats induced with LPS.
kDa 116 98 3.5 4.5 5.1 5.5 6.0 7.0 8.4 9.5 3.5 4.5 5.1 5.5 6.0 7.0 8.4 9.5 55 37 30 20 Diesel Exhaust Particle-Induced Nitro-Tyrosine Modifications RAW 264.7 macrophage exposed to DEP (Xiao, Loo, and Nel - UCLA) anti-nitro-tyrosine Sypro Ruby HSP70 Naf-1 enolase casein kinase II MnSOD MAPK phosphatase 2 trans. factor AP-2ß E2 G1
Phosphorylation • Analysis of the entire complement of phosphorylated proteins in cells: “phosphoproteome” • Qualitative and quantitative information regarding protein phosphorylation important • Important in many cellular processes • signal transduction, gene regulation, cell cycle, apoptosis • Most common sites of phosphorylation: Ser, Thr, Tyr • MS can be used to detect and map locations for phosphorylation • MW increase from addition of phosphate group • treatment with phosphatase allows determination of number of phosphate groups • digestion and tandem MS allows for determination of phosphorylation sites
precursor ion transmission collision cell (chamber) mass analysis of product ions MS/MS and Phosphorylation • Detection of phosphopeptides in complex mixtures can be facilitated by neutral loss and precurson ion scanning using tandem mass spectrometers • Allow selective visualization of peptides containing phosphorylated residues • Most commonly performed with triple quadrupole mass spectrometers
MS/MS and Phosphorylation • Precursor ion scan • Q1 is set to allow all the components of the mixture to enter the collision cell and undergo CAD • Q3 is fixed at a specific mass value, so that only analytes which fragment to give a fragment ion of this specific mass will be detected • Phospho-peptide fragments by CAD to give an ion at m/z 79 (PO3) • Set Q3 to m/z 79: only species which fragment to give a fragment ion of 79 reach the detector and hence indicating phosphorylation detector Q1 Q2 collision cell Q3
MS/MS and Phosphorylation • Neutral loss scan • Q1 and Q3 are scanned synchronously but with a specific m/z offset • The entire mixture is allowed to enter the collision cell, but only those species which fragment to yield a fragment with the same mass as the offset will be observed at the detector • pSer and pThr peptides readily lose phosphoric acid during CAD (98 Da) • For 2+ ion set offset at 49 • Any species which loses 49 from a doubly charged ion would be observed at the detector and be indicative of phosphorylation
Enrichment strategies to analyze phosphoproteins/peptides • Phosphospecific antibodies • Anti-pY quite successful • Anti-pS and anti-pT not as successful, but may be used (M. Grønborg, T. Z. Kristiansen, A. Stensballe, J. S. Andersen, O. Ohara, M. Mann, O. N. Jensen, and A. Pandey, “Approach for Identification of Serine/Threonine-phosphorylated Proteins by Enrichment with Phospho-specific Antibodies.” Mol. Cell. Proteomics 2002, 1:517–527. • Immobilized metal affinity chromatography (IMAC) • Negatively charged phosphate groups bind to postively charged metal ions (e.g., Fe3+, Ga3+) immobilized to a chromatographic support • Limitation: non-specific binding to acidic side chains (D, E) • Derivatize all peptides by methyl esterification to reduce non-specific binding by carboxylate groups. • Ficarro et al., Nature Biotech. (2002), 20, 301.
Direct MS of phosphopeptides bound to IMAC beads • Raska et al., Anal. Chem. 2002, 74, 3429 • IMAC beads placed directly on MALDI target • Matrix solution spotted onto target • MALDI-MS of peptides bound to IMAC bead • MALDI-MS/MS (*) to identify phosphorylation site(s)
MALDI-MS spectrum obtained from peptide bound to IMAC beads applied directly to MALDI target MALDI-MS/MS (Q-TOF) to locate phosphorylation site Sample enrichment with minimal sample handling contains phosphorylated residue
Enrichment strategies to analyze phosphoproteins/peptides • Chemical derivatization • Introduce affinity tag to enrich for phosphorylated molecules • e.g., biotin binding to immobilized avidin/streptavidin
Enrichment strategies to analyze phosphoproteins/peptides • Oda et al., Nature Biotech. 2001, 19, 379 for analysis of pS and pT • Remove Cys-reactivity by oxidation with performic acid • Base hydrolysis induce ß-elimination of phosphate from pS/pT • Addition of ethanedithiol allows coupling to biotin • Avidin affinity chromatography to purify phosphoproteins
Enrichment strategies to analyze phosphoproteins/peptides • Zhou et al., Nature Biotech. 2001, 19, 375 • Reduce and alkylate Cys-residues to eliminate their reactivity • Protect amino groups with t-butyl-dicarbonate (tBoc) • Phosphoramidate adducts at phosphorylated residues are formed by carbodiimide condensation with cystamine • Free sulfhydryls are covalently captured onto glass beads coupled to iodoacetic acid • Elute with trifluoroacetic acid
Chemical derivatization to enrich for phosphoproteins • Developed because other methods based on affinity/adsorption (e.g., IMAC) displayed some non-specific binding • Chemical derivatization methods may be overly complex to be used routinely • Sensitivity may not be sufficient for some experiments (low pmol)
Phosphoprotein Stain PeppermintStick phosphoprotein molecular weight standards separated on a 13% SDS polyacrylamide gel. The markers contain (from largest to smallest) beta-galactosidase, bovine serum albumin (BSA), ovalbumin, beta-casein, avidin and lysozyme. Ovalbumin and beta-casein are phosphorylated. The gel was stained with Pro-Q Diamond phosphoprotein gel stain (blue) followed by SYPRO Ruby protein gel stain (red). The digital images were pseudocolored. Phospho
Phosphoprotein Stain Visualization of total protein and phosphoproteins in a 2-D gel Proteins from a Jurkat T-cell lymphoma line cell lysate were separated by 2-D gel electrophoresis and stained with Pro-Q Diamond phosphoprotein gel stain (blue) followed by SYPRO Ruby protein gel stain (red). After each dye staining, the gel was imaged and the resulting composite image was digitally pseudocolored and overlaid. T.H. Steinberg et al., Global quantitative phosphoprotein analysis using Multiplexed Proteomics technology, Proteomics 2003, 3, 1128-1144
9.5 9.5 3.5 3.5 4.5 4.5 5.1 5.1 5.5 5.5 6.0 6.0 7.0 7.0 8.4 8.4 Global Analysis of Protein Phosphorylation RAW 264.7 exposed to DEP Pro-Q Diamond Sypro Ruby IEF 98 98 3 TNF convertase MAGUK p55 PDI Protein phosphatase 2A JNK-1 p38 MAPK alpha ERK-1 ERK-2 ErbB-2 TNF HSP 27 5 55 55 7 6 1 2 37 37 13 8 9 4 10 30 30 12 11 14 20 20 Xiao, Loo, and Nel - UCLA
Q A Rel. Abund. E B m/z H 516.725 516.828 Mass Spectrometry and Quantitative Measurements equimolar mixture of 2 peptides Mass spectrometry is inherently not a quantitative technique. The intensity of a peptide ion signal does not accurately reflect the amount of peptide in the sample. equimolar mixture of 2 peptides = 0.036 (M+2H)2+ : [12C]-ion [Val5]-Angiotensin II 1031.5188 (monoisotopic) Lys-des-Arg9-Bradykinin 1031.5552 (monoisotopic) m/z
Q Q A A E E B B 2D 2D H H 13C 13C 13C Mass Spectrometry and Quantitative Measurements equimolar mixture of 2 peptides Rel. Abund. m/z Two peptides of identical chemical structure that differ in mass because they differ in isotopic composition are expected to generate identical specific signals in a mass spectrometer. Methods coupling mass spectrometry and stable isotope tagging have been developed for quantitative proteomics.
ICAT: Isotope-Coded Affinity Tag • Alkylating group covalently attaches the reagent to reduces Cys-residues. • A polyether mass-encoded linker contains 8 hydrogens (d0) or 8 deuteriums (d8) that represents the isotope dilution. • A biotin affinity tag is used to selectively isolate tagged peptides (by avidin purification).
ICAT: Isotope-Coded Affinity Tag • The Cys-residues in sample 1 is labeled with d0-ICAT and sample 2 is labeled with d8-ICAT. • The combined samples are digested, and the biotinylated ICAT-labeled peptides are enriched by avidin affinity chromatography and analyzed by LC-MS/MS. • Each Cys-peptide appears as a pair of signals differing by the mass differential encoded in the tag. The ratio of the signal intensities indicates the abundance ratio of the protein from which the peptide originates. MS/MS identifies the protein
Stable Isotope Amino Acid or 15N- in vivo Labeling • Metabolic stable isotope coding of proteomes • An equivalent number of cells from 2 distinct cultures are grown on media supplemented with either normal amino acids or 14N-minimal media, or stable isotope amino acids (2D/13C/15N) or 15N-enriched media. • These mass tags are incorporated into proteins during translation.
R3 R4 R1 R2 R1 R2 R3 R4 (Arg, Lys) ...NH-CH-CO-NH-CH-CO-NH-CH-CO-NH-CH-COOH Trypsin /H218O C-terminal peptide NH2-CH-CO-NH-CH-COOH ...NH-CH-CO-NH-CH-CO-18OH Enzymatic Stable Isotope Coding of Proteomes • Enzymatic digestion in the presence of 18O-water incorporates 18O at the carboxy-terminus of peptides • Proteins from 2 different samples are enzymatically digested in normal water or H218O.
Identification of Low Abundance Proteins • The identification of low abundance proteins in the presence of high abundance proteins is problematic (e.g., “needle in a haystack”) • Pre-fractionation of complex protein mixtures can alleviate some difficulties • gel electrophoresis, chromatography, etc • Removal of known high abundance proteins allows less abundant species to be visualized and detected
Identification of Low Abundance Proteins GenWay Biotech
Additional Readings • R. Aebersold and M. Mann, Mass spectrometry-based proteomics, Nature (2003), 422, 198-207. • M. B. Goshe and R. D. Smith, “Stable isotope-coded proteomic mass spectrometry.” Curr. Opin. Biotechnol. 2003; 14: 101-109. • W. A. Tao and R. Aebersold, “Advances in quantitative proteomics via stable isotope tagging and mass spectrometry.” Curr. Opin. Biotechnol. 2003; 14: 110-118. • S. D. Patterson and R. Aebersold, “Proteomics: the first decade and beyond.” Nature Genetics 2003; 33 (suppl.): 311-323. • M. Mann and O. N. Jensen, “Proteomic analysis of post-translational modification.” Nature Biotech. 2003; 21: 255-261. • D. T. McLachlin and B. T. Chait, “Analysis of phosphorylated proteins and peptides by MS.” Curr. Opin. Chem. Biol. 2001; 5: 591-602. • S. Gygi et al., “Quantitative analysis of complex protein mixtures using isotope-coded affinity tags.” Nature Biotech. 1999; 17: 994-999.
Proteomics in Practice: A Laboratory Manual of Proteome Analysis Reiner Westermeier, Tom Naven Wiley-VCH, 2002 PART II: COURSE MANUAL Step 1: Sample Preparation Step 2: Isoelectric Focusing Step 3: SDS Polyacrylamide Gel Electrophoresis Step 4: Staining of the Gels Step 5: Scanning of Gels and Image Analysis Step 6: 2D DIGE Step 7: Spot Excision Step 8: Sample Destaining Step 9: In-gel Digestion Step 10: Microscale Purification Step 11: Chemical Derivatisation of the Peptide Digest Step 12: MS Analysis Step 13: Calibration of the MALDI-ToF MS Step 14: Preparing for a Database Search Step 15: PMF Database Search Unsuccessful PART I: PROTEOMICS TECHNOLOGY Introduction Expression Proteomics Two-dimensional Electrophoresis Spot Handling Mass Spectrometry Protein Identification by Database Searching Methods of Proteomics
Proteins and Proteomics: A Laboratory ManualRichard J. Simpson Cold Spring Harbor Laboratory (2002) Chapter 1. Introduction to Proteomics Chapter 2. One–dimensional Polyacrylamide Gel Electrophoresis Chapter 3. Preparing Cellular and Subcellular Extracts Chapter 4. Preparative Two–dimensional Gel Electrophoresis with Immobilized pH Gradients Chapter 5. Reversed–phase High–performance Liquid Chromatography Chapter 6. Amino– and Carboxy– terminal Sequence Analysis Chapter 7. Peptide Mapping and Sequence Analysis of Gel–resolved Proteins Chapter 8. The Use of Mass Spectrometry in Proteomics Chapter 9. Proteomic Methods for Phosphorylation Site Mapping Chapter 10. Characterization of Protein Complexes Chapter 11. Making Sense of Proteomics: Using Bioinformatics to Discover a Protein’s Structure, Functions, and Interactions