Sound and Hearing
Sound and Hearing. Nature of the Sound Stimulus. “Sound” is the rhythmic compression and decompression of the air around us caused by a vibrating object. Sound Wave: Amplitude and Frequency (Hz). Sound Pressure is measured in units called Pascals 1 Pascal (Pa) = 1 Newton of force/m 2

Sound and Hearing
E N D
Presentation Transcript
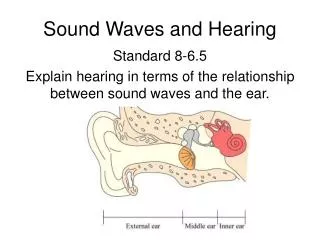
Nature of the Sound Stimulus “Sound”is the rhythmic compression and decompression of the air around us caused by a vibrating object.
Sound Wave:Amplitude and Frequency (Hz) Sound Pressure is measured in units called Pascals 1 Pascal (Pa) = 1 Newton of force/m2 1 atmosphere = 100,000 Pa Human absolute hearing threshold = 0.00002 Pa = 20 microPa (i.e., 2 ten billionths of an atmosphere) Frequency measured in cycles/sec = Hertz (Hz)Nominal range of sensitivity: 20 – 20,000 Hz
The “decibel” (dB) The decibelis a logarithmic unit used to describe a ratio (i.e., log (x/y)) In engineering analyses, it is used to normalize “power” measurements to a known reference and then compresses the resulting ratio using a log10 operation. This format is convenient for engineering analyses involving wide dynamic ranges (when very small and the very large magnitudes must be considered simultaneously). dB = 10 log(Observed Power / Reference)
dBSPL The transducers (microphones) on sound level meters measure sound pressure (i.e., N/m2 or Pascals). Pressure needs to be converted to power prior to calculation of the decibel equivalent….i.e., acoustic power = pressure2 Finally, we need to agree upon a Reference value. By convention, we use 20 microPa(i.e., the hearing threshold) Thus: dB = 10 log (Observed Pressure2 / 20 microPa2) However……..
dBSPL(continued) Prior to the advent of hand-held calculators and computers (circa 1970), performing a squaring operation was computationally expensive and prone to error. To reduce computational demands, hearing science adopted a somewhat confusing convention in the specification of the dBSPL unit: dBSPL= 20 log (Observed Sound Pressure / 20 microPa) +6 dBSPL = doubling sound pressure +20 dBSPL = 10x pressure +3 dBSIL = doubling acoustic power +10 dBSIL= 10x acoustic power
More about those pesky decibels • JND for sound intensity is about 1 dBSPLfor most of normal range of hearing • What does 0 dBSPL mean?Hint: 20 log (20 microPa/20 microPA) = 0 dBSPL • If one machine emits 80 dBSPL then how much sound amplitude would be expected from two machines side-by-side? 2 x 80 = 160 dBSPL ??? (That’s pretty intense) Convert from dBSPL back to raw pressure, sum the pressures, then convert sum to dBSPL 80 dBSPL antiLog(80/20) 10,000 20 log (10,000+10,000) = 86 dBSPL (approx.)
Inverse-Square Law Area of sphere = 4πr2
A “Better” Sound Amplitude Table? dBSPL Loud hand clapping at 1 m distance Siren at 10 m distance Hand (circular) power saw at 1 m Very loud expressway traffic at 25 m Lawn mower at 10 m Refrigerator at 1 m Talking; Talk radio level at 2 m Very quiet room fan at low speed at 1 m Normal breathing at 1 m 0 Absolute threshold
Complex Sound = Sum of Sines(Fourier Theorem Revisited) J.B.J. Fourier (1768-1830) Fourier Sound Applet
Speed of Sound Acoustic energy results from a traveling wave of rhythmic “compression” through a physical medium (e.g., air; water; steel). It is the “compression” that travels not the medium, per se. The characteristic speed of this travelling wave varies as a function of the medium (elasticity; density). The speed of acoustic energy through the air (aka “sound”) is 331 m/sec (or 742 MPH) at 0-deg C (Faster at higher temperatures).
The “Impedance Problem” 99.9% of sound energy in the air is reflected at the air:water boundary (10 log(0.1/100)) = -30 dB loss) (1/1000x) How does the ear compensate for this loss as sound energy is transmitted from the air to the fluid that filled the cochlea? 2 dB gain via ossicularleverage(1.6x) 25 dB gain via surface area condensation (eardrum stapes) (316x) ~5 dB gain at mid-frequencies (3x) due to pinna and auditory canal resonance
The Organ of Corti 3000-3500 Inner Hair Cells (IHC) 12,000 Outer Hair Cells (OHC)
Photomicrograph: Sensory Hair Cells Three rows of Outer Hair Cells One Row of Inner Hair Cells
Basilar Membrane ModulationEffects upon Sensory Hair Cells Note: K+ ion concentration gradient across sensory hair cells (see pink cavities)
IHC Stereocilia “Tip Links” “tip link” connects gate to adjacent cilia. Shearing motion forces gate to open. Mechanical open-and-close of gate modulates influx of potassium ions (much FASTER than slow chemical cascade in visual transduction). K+ depolarization of IHC triggers release of glutamate at cochlear nerve fiber synapse.
Innervation of 3000 IHCsversus 12,000 OHCs 30,000+ fibers in cochlear nerve. Nearly 10:1 fiber-to-IHC innervation ratio. Sparse number of fibers carry info from OHC to brain. Small number of fibers descend from brain to OHCs. Role of OHC’s? Mechanical gain otoacoustic emission
Sound Amplitude Coding(“Divide and Conquer”) Multiple nerve fibers for each IHC. Each nerve fiber tuned to a different 40 dB “range” of stimulus intensity. Intensity-level multiplexing
Tuning Specificity of Cochlear NerveFibers “Broadens” with Increased Intensity Q: Why the broadening and asymmetry? A: Look to the Basilar membrane’s response
Tonotopic Organizationof Primary Auditory Cortex (A1) Also note: Segregation of monaural versus binaural cells is maintained. Binaural cells loosely organized according to spatial location of stimulus source.
Auditory Frequency Coding(What is the neural code for “pitch”?)
Frequency Mechanism versusPlace Mechanism Frequency Theory Place Theory Ernest Rutherford (1871-1937) Georg von Békésy (1899-1972)
Frequency Theory (Rutherford) • Basilar membrane analogy to microphone diaphragm • Each oscillation yields nerve pulse • Problem: Max. neural response approx. 500 Hz • Solution: Time division multiplexing(aka “Volley Principle” )Supported by “cochlear microphonic” (Wever & Bray; but consider Botox results)
Von Békésy’s “Place Mechanism”as Biological Fourier Analyzer Basilar Membrane Dynamic Simulation (animation)
Minimum Audibility Curve Average detection threshold for 18-yr-olds for 1KHz tone at sea level is 20 microPa (μPa) Minimum occurs at approx. 3 KHz Binaural intensity thresholds are 3 dB lower than mono
Clinical Audiogram (dBHL) dB-HL (Hearing Level) uses a different reference level for each test frequency. That reference level represents the average threshold (18 yr-olds) demonstrated at that frequency. Hence, a value of 0 dB-HL means “average” hearing level at the frequency under test.
Normal vs. Noise-Induced Hearing Loss Note “notch” At 4 KHz. Source: http://mustelid.physiol.ox.ac.uk/drupal/?q=acoustics/clinical_audiograms
Age-related Hearing Loss(Presbycusis) Inevitable or preventable?
Stevens’ SONE SCALE of Loudness Perception Perceptual Anchor: 1 sone = loudness of 1 KHz at 40 dB (40 phons) Find the dB level that is twice as loud (2 sones) or half as loud (0.5 sones), etc. and construct a scale.[i.e., Magnitude Estimation] The psychological magnitude of sound (i.e., “Loudness”) grows at a slower rate than the physical magnitude of the sound stimulus. Loudness
Using magnitude estimation techniques, S.S. Stevens has quantified this nonlinear relationship as: L = k * P0.6 = k * I0.3 L=loudness; P=sound pressure (µPa)I=sound intensity (pW/m2) Stevens’ Power Law; Linear in log-log plot; slope ≈ exponent log(L)=log(k)+0.3 log(I) straight line log(L)≈0.3 log(I) Hence, a log unit increase (10dB) of intensity yields 0.3 log (100.3or 2-fold) increase in loudness. Note: Binaural presentation perceived as approx. 2x more loud than monaural equivalent. Loudness
Sone Scale Landmarks Normal conversation 1-4 Automobile @ 10m 4-16 Vacuum cleaner 16 Major roadway @ 10 m 16-32 Long-term hearing damage dosage 32+ Jackhammer @ 1m 64 Brief-exposure hearing damage 256 Pain threshold 676
Temporal Summation (< 200 msec)Complements Binaural (i.e., Spatial) Summation
Equal Loudness Contours Frequency differentiation is flattened at high amplitudes; Speech and music sounds “tinny” at high loudness levels; Remember change in cochlear nerve tuning at higher intensity levels.
Tonal Masking:Psychophysical Tuning Curves Fixed test tone (e.g., 1KHz @ +10 dB)Frequency of masking tone varied How intense must masking tone be in order to make the test tone indiscriminable? Plot of masking intensity thresholds reveals frequency tuning of underlying auditory processing channel(s)