Download
1 / 61
630 likes | 847 Vues
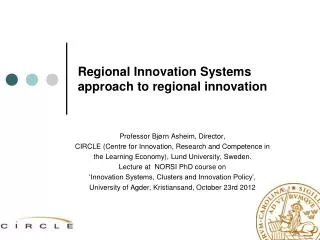
Regional Innovation Ecosystems & Service Science. Working Together to Build a Smarter Planet. Dr. James (“Jim”) C. Spohrer spohrer@us.ibm.com Innovation Champion and Director, IBM University Programs WW RIT Service Innovation Event, Rochester, NY, USA, April 14th, 2011. Outline.

E N D
Regional Innovation Ecosystems & Service Science Working Together to Build a Smarter Planet Dr. James (“Jim”) C. Spohrer spohrer@us.ibm.com Innovation Champion and Director, IBM University Programs WW RIT Service Innovation Event, Rochester, NY, USA, April 14th, 2011
Outline • Stimulus:Service Growth • The World (Rethinking Product-Service Systems) • IBM (Overview, Centennial, Watson, Smarter Planet) • Response:Service Science Priorities • Cambridge University Report (2007, 2008, 2011) • UK Royal Society Report (2009) • Arizona State University Report (2010) • Handbook of Service Science (2011) • Open Services Innovation (2011) • Evolution:Regional Innovation Ecosystems • What is a “Smarter Planet”? “Quality of Life” Improvement? • Quality of Life: Our growing dependence on networks of interconnected service systems • Local optimization does not equal global optimization • Local problems can cascade into global significance • Global competition for talent (“vote with feet”) • How are Cities & Universities Linked? What Jobs & Skills? • How to visualize Service Science? Systems & Knowledge? • What is a Holistic Service System (HSS)? Value-CoCreation (VCC)? • Where is the “Real Science”? VCC Architectures & HSS
Regional Innovation Ecosystems: NY StateTop Employers (Healthy, Frugal, Wealthy, Innovative, Wealthy, Wise…)
Service Growth: The World World’s Large Labor Forces A = Agriculture, G = Goods, S = Service US shift to service jobs 2010 2010 (A) Agriculture: Value from harvesting nature Nation Labor % WW A % G % S % 40yr Service Growth China 25.7 49 22 29 142% India 14.4 60 17 23 35% (G) Goods: Value from making products U.S. 5.1 1 23 76 23% Indonesia 3.5 45 16 39 34% (S) Service: Value from IT augmented workers in smarter systems that create benefits for customers and sustainably improve quality of life. Brazil 3.0 20 14 66 61% Russia 2.4 10 21 69 64% Japan 2.2 5 28 67 45% Nigeria 1.6 70 10 20 19% Bangladesh 2.1 63 11 26 37% Germany 1.4 3 33 64 42% CIA Handbook, International Labor Organization Note: Pakistan, Vietnam, and Mexico now larger LF than Germany
Factory as a Product-Service Systemhttp://www.youtube.com/watch?v=nd5WGLWNllA
SSE SSE SSE SSE SSE SSE SSE SSE SSE SSE F F F F F F F F F F Front-Stage Marketing/Customer Focus Based on Levitt, T (1972) Production-line approach to service. HBR. “Everybody is in service... Something is wrong… The industrial world has changed faster than our taxonomies.”. B B B B B B B B B B e.g., Citibank F F F Product-Service-System Service System Entity Product Business Service Business F B B B B e.g., IBM Back-Stage Operations/Provider Focus Rethinking “Product-Service Systems”
Service Growth: IBM Revenue Growth by Segment What do IBM Service Professionals Do? Run things on behalf of customers, help Transform customers to adopt best practices, and Innovate with customers. B2B Service Projects: IT (data center, call centers) & business process outsourcing/reengineering, systems integration, organizational change, etc.
IBM has 426,000 employees worldwide • 2010 Financials • Revenue - $ 99.9B • Net Income - $ 14.8B • EPS - $ 11.52 • Net Cash - $11.7B 21% of IBM’s revenue in growth market countries; growing at 13% in late 2010 More than 40% of IBM’s workforce conducts business away from an office IBM operates in 170 countries around the globe Number 1 in patent generation for 18 consecutive years ; 5,896 US patents awarded in 2010 Smarter Planet 5 Nobel Laureates 9 time winner of the President’s National Medal of Technology & Innovation - latest award for Blue Gene Supercomputer
IBM Centennial – 100 Years of Innovation! IBM Centennial Film: 100 People & 100 Years http://www.youtube.com/watch?v=39jtNUGgmd4
Priorities: Succeeding through Service Innovation - A Framework for Progress (http://www.ifm.eng.cam.ac.uk/ssme/) Source: Workshop and Global Survey of Service Research Leaders (IfM & IBM 2008) 1. Emerging demand 5. Call for actions 2. Define the domain 3. Vision and gaps 4. Bridge the gaps Service Innovation Growth in service GDP and jobs Service quality & productivity Environmental friendly & sustainable Urbanisation & aging population Globalisation & technology drivers Opportunities for businesses, governments and individuals Service Systems Customer-provider interactions that enable value cocreation Dynamic configurations of resources: people, technologies, organisations and information Increasing scale, complexity and connectedness of service systems B2B, B2C, C2C, B2G, G2C, G2G service networks Stakeholder Priorities Education Research Business Government The white paper offers a starting point to - Service Science To discover the underlying principles of complex service systems Systematically create, scale and improve systems Foundations laid by existing disciplines Progress in academic studies and practical tools Gaps in knowledge and skills Develop programmes & qualifications Skills & Mindset Encourage an interdisciplinary approach Knowledge & Tools Develop and improve service innovation roadmaps, leading to a doubling of investment in service education and research by 2015 Employment & Collaboration Policies & Investment Glossary of definitions, history and outlook of service research, global trends, and ongoing debate
Pervasive Force: Leveraging Technology to Advance Service Strategy Priorities Development Priorities Execution Priorities Stimulating Service Innovation Fostering Service Infusion and Growth Effectively Branding and Selling Services Enhancing Service Design Improving Well-Being through Transformative Service Enhancing the Service Experience through Cocreation Creating and Maintaining a Service Culture Optimizing Service Networks and Value Chains Measuring and Optimizing the Value of Service Priorities: Research Framework for the Science of Service Source: Global Survey of Service Research Leaders (Ostrom et al 2010)
UK Royal Society Report: Science in Service Innovationhttp://royalsociety.org/Hidden-wealth-The-contribution-of-science-to-service-sector-innovation/
COMMUNICATIONS PRODUCTS WORKFORCE TRANSPORTATION SUPPLY CHAIN BUILDINGS What is Smarter Planet?Harmonized smarter product-service systems. INSTRUMENTED We now have the ability to measure, sense and see the exact condition of practically everything. INTERCONNECTED People, systems and objects can communicate and interact with each other in entirely new ways. INTELLIGENT We can respond to changes quickly and accurately, and get better results by predicting and optimizing for future events. IT NETWORKS
Our planet is a complex, dynamic, highly interconnected $54 Trillion system-of-systems (OECD-based analysis) Our planet is a complex system-of-systems Transportation $ 6.95 Tn Communication $ 3.96 Tn This chart shows ‘systems‘ (not ‘industries‘) Education $ 1.36 Tn Water $ 0.13 Tn Leisure / Recreation / Clothing $ 7.80 Tn Electricity $ 2.94 Tn Global system-of-systems $54 Trillion (100% of WW 2008 GDP) Healthcare $ 4.27 Tn Infrastructure $ 12.54 Tn Legend for system inputs Same IndustryBusiness SupportIT SystemsEnergy ResourcesMachineryMaterials Trade Note: 1. Size of bubbles represents systems’ economic values 2. Arrows represent the strength of systems’ interaction 1 Tn Govt. & Safety$ 5.21 Tn Finance $ 4.58 Tn Food $ 4.89 Tn Source: IBV analysis based on OECD
This chart shows ‘systems‘ (not ‘industries‘) Analysis of inefficiencies in the planet‘s system-of-systems Healthcare 4,270 Building & Transport Infrastructure12,540 34% Education 1,360 Financial4,580 42% Electricity2,940 Improvement potential as % of system inefficiency Food & Water4,890 Communication3,960 Government & Safety 5,210 Transportation (Goods & Passenger)6,950 Leisure / Recreation / Clothing7,800 Note: Size of the bubble indicate absolute value of the system in USD Billions System inefficiency as % of total economic value We now have the capabilities to manage a system-of-systems planet Economists estimate, that all systems carry inefficiencies of up to $15 Tn, of which $4 Tn could be eliminated How to read the chart: For example, the Healthcare system‘s value is $4,270B. It carries an estimated inefficiency of 42%. From that level of 42% inefficiency, economists estimate that ~34% can be eliminated (= 34% x 42%). Source: IBM economists survey 2009; n= 480
Well Being Index • January 10, 2011By Mark Whitehouse at mark.whitehouse@wsj.com • One approach is to enhance GDP with other objective factors such as inequality, leisure and life expectancy. In a paper presented Saturday at the American Economic Association meeting, Stanford economists Peter Klenow and Charles Jones found that doing so can make a big difference. • Making everybody work 120 hours a week could radically boost a country's GDP per capita, but it wouldn't make people happier. Removing pollution limits could boost GDP per hour worked, but wouldn't necessarily lead to a world we'd want to live in.
What improves Quality-of-Life? Product-Service System Innovations 20/10/10 * = US Labor % in 2009. A. Systems that focus on flow of things that humans need (~15%*) 1. Transportation & supply chain 2. Water & waste recycling/Climate & Environment 3. Food & products manufacturing 4. Energy & electricity grid/Clean Tech 5. Information and Communication Technologies (ICT access) B. Systems that focus on human activity and development (~70%*) 6. Buildings & construction (smart spaces) (5%*) 7. Retail & hospitality/Media & entertainment/Tourism & sports (23%*) 8. Banking & finance/Business & consulting (wealthy) (21%*) 9. Healthcare & family life (healthy) (10%*) 10. Education & work life/Professions & entrepreneurship (wise) (9%*) C. Systems that focus on human governance - security and opportunity (~15%*) 11. Cities & security for families and professionals (property tax) 12. States/regions & commercial development opportunities/investments (sales tax) 13. Nations/NGOs & citizens rights/rules/incentives/policies/laws (income tax) 2/7/4 2/1/1 7/6/1 1/1/0 5/17/27 1/0/2 24/24/1 2/20/24 7/10/3 5/2/2 3/3/1 0/0/0 0/19/0 1/2/2 Quality of Life = Quality of Service + Quality of Jobs + Quality of Investment-Opportunities “61 Service Design 2010 (Japan) / 75 Service Marketing 2010 (Portugal)/78 Service-Oriented Computing 2010 (US)”
Regional Innovation Ecosystems& Holistic Service Systemshttp://www.service-science.info/archives/1056 Examples: Nations, States, Cities, Universities, Luxury Hotels, Cruise Ships, Households Subsystems: Transportation, Water, Food, Energy, Communications, Buildings, Retail, Finance, Health, Education, Governance, etc. Definition: A service system that can support its primary populations, independent of all external service systems, for some period of time, longer than a month if necessary, and in some cases, indefinitely Balance independence with interdependence, without becoming overly dependent Nation State/Province City/Region Luxury Resort Hotels University Colleges K-12 Hospital Medical Research Family (household) Person (professional) For-profits Start-Ups Non-profits SaaS PaaS IaaS ~25-50% of start-ups are new IT-enabled service offerings A Day Made of Glass: Corning http://www.youtube.com/watch?v=w12B02eJpaM&feature=fvst
Population Challenges Opportunities Careers Cities as Holistic Service Systems: All the systems A. Flow of things 1. Transportation: Traffic congestion; accidents and injury 2. Water: Access to clean water; waste disposal costs 3. Food: Safety of food supply; toxins in toys, products, etc. 4. Energy: Energy shortage, pollution 5. Information: Equitable access to info and comm resources B. Human activity & development 6. Buildings: Inefficient buildings, environmental stress (noise, etc.) 7. Retail: Access to recreational resources 8. Banking: Boom and bust business cycles, investment bubbles 9. Healthcare: Pandemic threats; cost of healthcare 10. Education: High school drop out rate; cost of education C. Governing 11. Cities: Security and tax burden 12. States: Infrastructure maintenance and tax burden 13. Nations: Justice system overburdened and tax burden Example: Singapore
Universities as Holistic Service Systems: All the systems A. Flow of things 1. Transportation: Traffic congestion; parking shortages. 2. Water: Access costs; reduce waste 3. Food: Safety; reduce waste. 4. Energy: Access costs; reduce waste 5. Information: Cost of keeping up best practices. B. Human activity & development 6. Buildings: Housing shortages; Inefficient buildings 7. Retail: Access and boundaries. Marketing. 8. Banking: Endowment growth; Cost controls 9. Healthcare: Pandemic threat. Operations. 10. Education: Cost of keeping up best practices.. C. Governing 11. Cities: Town & gown relationship. 12. States: Development partnerships.. 13. Nations: Compliance and alignment.
Luxury Hotels as Holistic Service Systems: All the systems http://www.youtube.com/watch?v=Hm7MeZlS5fo
Government Service to Individuals & Institutions Cities & Public Safety Transportation University: The Heart of Regional Innovation Ecosystems Retail & Hospitality Finance $ Energy Education Building Food & Products ICT (Computing & Communications) Health University & Regional Innovation Ecosystems (Why?) Incubator & Start-Ups School of Urban Planning School of Science & Arts School of Public Policy School of Hospitality School of Business Mngmnt University: The Heart of Regional Innovation Ecosystems School of Education School of Information School of Architecture School of Engineering School of Medicine
Universities & Regional Innovation Ecosystems (Data)% GDP and % Top-500-Universities Strong Correlation (2009 Data): National GDP and University Rankings http://www.upload-it.fr/files/1513639149/graph.html
Accelerating Regional Innovation: Universities as “Living Labs” for Host Cities CITIES/METRO REGIONS: Universities Key to Long-Term Economic Development UNIVERSITIES: Research Centers & Real-World Systems
Edu-Impact.Com: Growing Importance of Universities with Large, Growing Endowments “When we combined the impact of Harvard’s direct spending on payroll, purchasing and construction – the indirect impact of University spending – and the direct and indirect impact of off-campus spending by Harvard students – we can estimate that Harvard directly and indirectly accounted for nearly $4.8 billion in economic activity in the Boston area in fiscal year 2008, and more than 44,000 jobs.”
Growing Importance of HPC to Universities • HPC = High Performance Computing (2006 NSF Data) With HPC Without HPC Average NSF funding: $30,354,000 Average NSF funding: $7,781,000 95 of Top NSF-funded Universities with HPC 98 of Top NSF-funded Universities w/out HPC Journal of Information Technology, Volume 10, Issue 2 (accepted) www.jiti.net
Urban-Age.Net Currently, the world’s top 30 cities generate 80% of the world’s wealth. The Urban Age For the first time in history more than 50% the earth’s population live in cities - by 2050 it will be 75% The Endless City
Engineering School Business School D transportation water & waste D D I-School Design D health food & supply chain energy/grid e-government Science & Mathematics Social Sciences, Humanities D Professional Studies D University Trend: “Sister Campuses” (People Flows) • University sub-systems • Disciplines in Schools (circles) • Innovation Centers (squares) • E.g., CMU Website (2009) • “Research Centers:where it all happens – to solve real-world problems” • Disciplines in Schools • Award degrees • Single-discipline focus • Research discipline problems • Innovation Centers (ICs) • Industry/government sponsors • Multi-disciplinary teams • Research real-world systems
Developed Market Nations (> $20K GDP/Capita) Emerging Market Nations (< $20K GDP/Capita) City Trend: “Sister Cities” (People Flows) • World as System of Systems • World (light blue - largest) • Nations (green - large) • Regions (dark blue - medium) • Cities (yellow - small) • Universities (red - smallest) • Cities as System of Systems • Transportation & Supply Chain • Water & Waste Recycling • Food & Products ((Nano) • Energy & Electricity • Information/ICT & Cloud (Info) • Buildings & Construction • Retail & Hospitality/Media & Entertainment • Banking & Finance • Healthcare & Family (Bio) • Education & Professions (Cogno) • Government (City, State, Nation) • Nations: Innovation Opportunities • GDP/Capita (level and growth rate) • Energy/Capita (fossil and renewable) IBM UP WW: Tandem Awards: Increasing university linkages (knowledge exchange interactions)
What is a Service System? What is Service Science? …customers just name <your favorite provider>…researchers just name <your favorite discipline> Design/ Cognitive Science Systems Engineering “service science is the interdisciplinary study of service systems & value-cocreation” “a service system is a human-made system to improve customer-provider interactions, or value-cocreation” Marketing Computer Science/ Artificial Intelligence Operations Economics & Law
Systems that govern Systems that focus on flows of things Systems that support people’s activities transportation & supply chain ICT & cloud retail & hospitality healthcare & family city secure food & products education &work state scale nation laws energy & electricity water & waste building & construction banking & finance behavioral sciences People Technology Information Organizations Customer Provider Authority Competitors resources stakeholders e.g., marketing management sciences Starting Point 1: The Stakeholders (As-Is) e.g., operations political sciences e.g., public policy learning sciences e.g., game theory and strategy cognitive sciences e.g., psychology system sciences Starting Point 2: Their Resources (As-Is) e.g., industrial eng. information sciences e.g., computer sci organization sciences e.g., knowledge mgmt social sciences History (Data Analytics) Future (Roadmap) change Change Potential: Thinking (Has-Been & Might-Become) e.g., econ & law decision sciences e.g., stats & design run professions Run Transform (Copy) Innovate (Invent) e.g., knowledge worker value Value Realization: Doing (To-Be) transform professions e.g., consultant innovate professions e.g., entrepreneur systems How to visualize service science? The Systems-Disciplines Matrix disciplines
Many team-oriented service projects completed (resume: outcomes, accomplishments & awards) Many disciplines (understanding & communications) Many systems (understanding & communications) Deep in one discipline (analytic thinking & problem solving) Deep in one system (analytic thinking & problem solving) What is the skills goal? T-Shaped professionals, ready for T-eamwork! SSME+D = Service Science, Management, Engineering + Design
Jobs: Expert Thinking & Complex Communications Increasing usage of job descriptive terms Expert Thinking (deep) Complex Communication (broad) Routine Manual Non-routine Manual Routine Cognitive Based on U.S. Department of Labor’ Dictionary of Occupational Titles (DOT) Levy, F, & Murnane, R. J. (2004). The New Division of Labor:How Computers Are Creating the Next Job Market. Princeton University Press.
Job Roles: IBM Building Smarter Enterprises & A Smarter Planethttps://jobs3.netmedia1.com/cp/find.ibm.jobs/location/ • IBM Employees • ~10% Consultant • ~10% Sales • ~5% Architect • ~5% Project Manager • ~45% Specialists • ~25% Enterprise Operations Project Mix From 90-10 to 80-20: B2B – Business to Business B2G – Business to Government ~10% • 1. Consultant • (trusted advisor to customer) • a value proposition to addressproblems or opportunities andenhance value co-creationrelationships ~5% ~10% • 3. Architect • (systems engineer, IT & enterprise architect) • An elegant solution design that satisfiesfunctional and non-functionalconstraints across thesystem life-cycle • 2. Sales • a signed contract thatdefines work, outcomes, solution,rewards and risks for all parties ~5% 4. Project Manager (often with co-PM from customer side) a detailed project plan thatbalances time, costs, skills availability,and other resources, as well asadaptive realization of plan ~45% ~25% • 5. Specialists • (systems engineer, Research, engineer, • Industry specialist, application, technician, • data, analyst, professional, agent) • a compelling working system(leading-edge prototype systemsfrom Research) 6. Enterprise Operations Administrative Services, Other, Marketing & Communications Finance, Supply Chain, Manufacturing, Human Resources, Legal, General Executive Management
Service Management:Operations, Strategy,and Information Technology • By Fitzsimmons and Fitzsimmons, UTexas Teaching SSME+D • Fitzsimmons & Fitzsimmons • Graduate Students • Schools of Engineering & Businesses • Teboul • Undergraduates • Schools of Business & Social Sciences • Busy execs (4 hour read) • Ricketts • Practitioners • Manufacturers In Transition • And 200 other books… • Zeithaml, Bitner, Gremler; Gronross, Chase, Jacobs, Aquilano; Davis, Heineke; Heskett, Sasser, Schlesingher; Sampson; Lovelock, Wirtz, Chew; Alter; Baldwin, Clark; Beinhocker; Berry; Bryson, Daniels, Warf; Checkland, Holwell; Cooper,Edgett; Hopp, Spearman; Womack, Jones; Johnston; Heizer, Render; Milgrom, Roberts; Norman; Pine, Gilmore; Sterman; Weinberg; Woods, Degramo; Wooldridge; Wright; etc. • URL: http://www.cob.sjsu.edu/ssme/refmenu.asp • Service Is Front Stage:Positioning services forvalue advantage • By James Teboul, INSEAD • Reaching the Goal: How Managers Improve a Services Business Using Goldratt’s Theory of Constraints • By John Ricketts, IBM
“Try to operate inside the comfort zone” “Double monetize, internal win and ‘sell’ to external” “To be the best, learn from the rest” Product-Service Systems as Learning Systems L Linda Sanford, IBM “Let Go To Grow”
Technology Technology Technology Technology Technology Technology Technology Technology Run Technology Technology Transform Invest in each type of change Technology Technology Technology Technology Innovate How entities (service systems) learn and change over timeHistory and future of Run-Transform-Innovate investment choices • Diverse Types • Persons (Individuals) • Families • Regional Entities • Universities • Hospitals • Cities • States/Provinces • Nations • Other Enterprises • Businesses • Non-profits • Learning & Change • Run = use existing knowledge or standard practices (use) • Transform = adopt a new best practice (copy) • Innovate = create a new best practice (invent) exploit explore March, J.G. (1991) Exploration and exploitation in organizational learning. Organizational Science. 2(1).71-87.
Service Systems: Stakeholders & Resources 1. People 2. Technology 3. Shared Information 4. Organizationsconnected by win-win value propositions Computational System Building Smarter Technologies Requires investment roadmap Building Smarter Universities & Cities Requires investment roadmap Smarter = Sustainable Innovation (reduce waste, expand capabilities)
What happens when you take some of the nicotine out of cigarettes?
Corning: A Day Made of Glasshttp://www.youtube.com/watch?v=6Cf7IL_eZ38
14B Big Bang (Natural World) 10K Cities (Human-Made World) bees (social division-of-labor) transistor 60 200M Where is the “Real Science”? In the interdisciplinary sciences that study the natural and human-made worlds… Unraveling the mystery of evolving hierarchical-complexity in new populations… To discover the world’s structures and mechanisms for computing non-zero-sum Value-CoCreation (VCC) Architectures & Holistic Service Systems (HSS) Time writing (symbols and scribes) ECOLOGY written laws money (coins) Sun Earth bacteria (uni-cell life) sponges (multi-cell life) universities clams (neurons) printing press (books) trilobites (brains) steam engine
Thank-You! Questions? “Instrumented, Interconnected, Intelligent – Let’s build a Smarter Planet.” – IBM “If we are going to build a smarter planet, let’s start by building smarter cities” – CityForward.org “Universities are major employers in cities and key to urban sustainability.” – Coalition of USU “Cities learning from cities learning from cities.” – Fundacion Metropoli “The future is already here… It is just not evenly distributed.” – Gibson “The best way to predict the future is to create it/invent it.” – Moliere/Kay “Real-world problems may not/refuse to respect discipline boundaries.” – Popper/Spohrer “Today’s problems may come from yesterday’s solutions.” – Senge “History is a race between education and catastrophe.” – H.G. Wells “The future is born in universities.” – Kurilov “Think global, act local.” – Geddes • Dr. James (“Jim”) C. Spohrer • Director, IBM University Programs (IBM UP) WW • spohrer@us.ibm.com
Service System Ecology: Conceptual Framework • Resources: People, Technology, Information, Organizations • Stakeholders: Customers, Providers, Authorities, Competitors • Measures: Quality, Productivity, Compliance, Sustainable Innovation • Access Rights: Own, Lease, Shared, Privileged
Service-dominant logic Service is the application of competences for the benefit of another entity Serviceis exchanged for service Value is always co-created Goods are appliances for delivery Alleconomies are service economies All businesses are service businesses Value Configuration Density Resource Integrator/Beneficiary Resource Integrator/Beneficiary (“Firm”) (“Customer”) Value Co-creation Vargo, S. L. & Lusch, R. F. (2004). Evolving to a new dominant logic for marketing. Journal of Marketing, 68, 1 – 17.
Value depends on the capabilities a system has to survive and create beneficial change in its environment. Taking advantage of the service another system offers means incorporating improved capabilities. Value can be defined as system improvement in an environment. All ways that systems work together to improve or enhance one another’s capabilities can be seen as being value creating. What is value? Vargo, S. L., Maglio, P. P., and Akaka, M. A. (2008). On value and value co-creation: A service systems and service logic perspective. European Management Journal, 26(3), 145-152.