Download
1 / 42
450 likes | 707 Vues
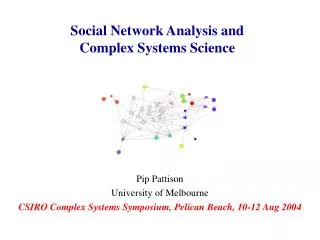
Social Network Analysis and Complex Systems Science. Pip Pattison University of Melbourne CSIRO Complex Systems Symposium, Pelican Beach, 10-12 Aug 2004. In collaboration with:. Garry Robins, University of Melbourne Tom Snijders, University of Groningen Henry Wong, University of Melbourne

E N D
Social Network Analysis and Complex Systems Science Pip Pattison University of Melbourne CSIRO Complex Systems Symposium, Pelican Beach, 10-12 Aug 2004
In collaboration with: Garry Robins, University of Melbourne Tom Snijders, University of Groningen Henry Wong, University of Melbourne Jodie Woolcock, University of Melbourne Emmanuel Lazega, University of Lille I Kim Albert, University of Melbourne Anne Mische, Rutgers University John Padgett, University of Chicago Peng Wang, University of Melbourne
1. Why are social networks important? For understanding action in relation to its social context network ties link actors to each other as well as to groups, cultural resources, neighbourhoods, communities networks structure opportunities and constraints For understanding social dynamics social action is interactive: one person’s action changes the context for those to whom they are connected To understand the cumulation of local processes into population level outcomes The structure of networks and the dynamics of local processes are critical to understanding how locally interactive, context-dependent actions cumulate into outcomes at higher levels (eg communities, populations)
Social units individuals groups ... Ties among social units person-to-person person-to-group ... Settings geographical sociocultural ... For example: Interactions between social units depend on proximity through ties Interactions between ties depend on proximity through settings There are interactions within and between levels Social structure: regularities in interactions A simplified multi-layered and relational framework for the social world
2: Typical data structures Network observations give rise torelational data structures, e.g.: People groups, people attributes, groups attributes, people settings, groups settings, people people people people types of tie, people people settings, … Some important design issues: Network boundaries? Complete: which “nodes” to include? Which network ties? What are the relevant network links? How do we best “measure” them?
Example 1: Management consulting firm node colour codes workgroup membershipnode size codes extent of cohesive beliefsties: “Who do you ask when you want to find out what is going on..?”
Example 2: Network of Mutual Collaboration Ties (Lazega, 1999)
Example 3: Change in interorganizational networks (Goldman et al, 1994) Data are from an evaluation of the Robert Wood Johnson Program on Chronic Mental Illness in 6 US cities (one of which was a “control” site) Organisations Mental health agencies in the “control” site (n =37) Networks at time 1 and time 2 (x1, x2) Client referrals Information-sharing Fund-sharing Data are from key informants and were gathered two years apart
3: Modelling networks and other relational structures Guiding principles: 1. Network ties (and other observations) are the outcome of unobserved processes that tend to be local and interactive 2. There are both regularities and irregularities in these local interactive processes Hence we aim for a stochastic model formulation in which: • local interactions are permitted and assumptions about “locality” are explicit • regularities are represented by model parameters and estimated from data • consequences of local regularities for global network properties can be understood and can also provide an exacting approach to model evaluation
Building models for social networks We model tie variables: X = [Xij] Xij = 1 if i has a tie to j 0 otherwise realisation of X is denoted by x = [xij] Two modelling steps: methodological: define two network tie variables to be neighbours if they are conditionally dependent, given the values of all other tie variables Substantive: what are appropriate assumptions about the neighbourhood relation (ie about the network topology)?
Network topologies: which tie variables are neighbours? Two tie variables are neighbours if: they share a dyad dyad-independent model they share an actor Markov model they share a connection realisation-dependent model with the same tie They share a connection k-triangle model with two ties etc...
Models for interactive systems of variables(Besag, 1974) Hammersley-Clifford theorem: A model for X has a form determined by its neighbourhoods, where a neighbourhoodis a set of mutually neighbouring variables This general approach leads to: P(X= x) = (1/c) exp{Q QzQ(x)} normalizing quantity parameter network statistic the summation is over all neighbourhoods Q zQ(x) = XijQxijsignifies whether c = xexp{Q QzQ(x)} all ties in Q are observed in x
Assumptions: two ties are neighbours: if they share a dyad dyad-independence if they share an actor Markov if they share a connection with the same tie realisation-dependent Configurations for neighbourhoods edge + 2-star 3-star 4-star ... triangle + ... 3-path 4-cycle “coathanger” Neighbourhoods depend on proximity assumptions
k-triangle model 2 ties are neighbours if they create a 4-cycle configurations include: k nodes k-independent k-triangle 2-path useful for higher-order clustering effects Neighbourhoods, continued
Homogeneous Markov random graphs (Frank & Strauss, 1986) P(X = x) = (1/c) exp{L(x) + 2S2(x) + … + kSk(x) + … + T(x)} where: L(x) no of edges in x S2(x) no of 2-stars in x … Sk(x) no. of k-stars in x … … T(x) no of triangles in x
Simulating from homogeneous Markov random graph distributions on 36 nodes: a typical graph Parameter values: = -3 2 = 2 = 0 3 = -2 Average statistics: edges 57.0 2-stars 133.8 triangles 2.3 3-stars 68.4
A typical graph for = 10 Parameter values: = -3 2 = 2 = 10 3 = -2 Average statistics: edges 92.0 2-stars 390.0 triangles 130.0 3-stars 440.0
These models can represent very different network structures: eg small worlds: =-4, 2=0.1, 3=-0.05, =1[Robins, Pattison & Woolcock, in press] No of edges L=126 path length distribution Q1 = 4 (5) Q2 = 5 (7) Q3 = () clustering coefficient Cluster = 0.09 (0.02) figures for Bernoulli distribution in red
Longer path worlds: =-1.2, 2=0.05, 3=-1, =1but levels of clustering are still high No of edges=118 Q1 = 5 (5) Q2 = 7 (7) Q3 = 9 () Cluster = 0.08 (0.02)
Very long path worlds: =-2.2, 2=0.05, 3=-2, =1(no clustering) L=82 Q1 = (11) Q2 = () Q3 = () Cluster = 0.00 (0.02)
Simulations of two-star models (n=30) (a) = 0, 2 =[0.00, 0.01,…0.10](see also Handcock, 2004; Park & Newman, 2004; Snijders, 2002) average no of degree 2-stars complete graph has no of successful moves high probability for high values of 2 Metropolis algorithmmultiple random starts
(b) = -2.5, 2 =[-0.50, -0.45,…,0.25] average no of degree 2-stars sharp transition from low to high no of successful moves density graphs around 2 = -/(n-2)
“Freezing” at 2 = -/(n-2): (,2) = (-14,0.5)/t for t = 0,1,… Average degree Successful moves See Park and Newman (2004) for an analytical solution (including phase diagram)
4: Applications: Estimation of model parameters and model evaluation • Estimation of model parameters from data: MLE via MCMC approaches (Snijders, 2002; Handcock et al, 2004) • Model evaluation: do substantively important global properties of the observed data resemble simulated data? For example: Degree distribution Path length distribution Presence of clustering, cycles The overall aim is to identify regularities in local relational structures, and at the same time build models that reproduce global network structure from empirically-grounded local regularities
The alternating k-star, k-independent 2-path and k-triangle hypotheses (Snijders, Pattison, Robins & Handcock, 2004) Suppose that: k = -k-1/ where 1 is a (fixed) constant alternating k-star hypothesis Then kSk(x)k = S[](x) 2where: S[](x) = 2 i{(1 - 1/)d(i) + d(i)/ - 1} and d(i) denote the degree of node i alternating k-star statistic Likewise: If Uk(x) = no of k-independent 2-paths in x, with corresponding parameter k and Tk(x) = no of k-triangles in x, with corresponding parameter k We can suppose that: k+1 = - k/ alternating independent 2-path hypothesis k+1 = - k/ alternating k-triangle hypothesis
Network of Collaboration Ties
Realisation-dependent model for colaboration ties among lawyers (Pattison & Robins, 2002)
MCMCML parameter estimates for collaboration network (SIENA, conditioning on total ties, partners only) Model 1 Model 2 Parameter est s.e. est s.e. alternating k-stars (=3) -0.083 0.316 Alternating ind. 2-paths (=3) -0.042 0.154 Alternating k-triangles (=3) 0.572 0.190 0.608 0.089 No pairs connected by a 2–path -0.025 0.188 No pairs lying on a triangle 0.486 0.513 Seniority main effect 0.023 0.006 0.024 0.006 Practice (corp. law) main effect 0.391 0.116 0.375 0.109 Same practice 0.390 0.100 0.385 0.101 Same gender 0.343 0.124 0.359 0.120 Same office 0.577 0.110 0.572 0.100
Modelling group cohesion (Albert, 2002) Network ties are important in understanding social processes, but so are: cultural and psychological resources and aspirations (beliefs, values, attitudes, knowledge) settings (geographical locations, physical and organisational constraints) Lindenberg (1997) on groups: Three overlapping forms of interdependence: functional (common goals and tasks) workgroup membership cognitive (psychological representations) beliefs structural (patterning of interpersonal ties) network ties Albert (2002) on group cohesion: An illustrative analysis of interdependent functional, cognitive and structural aspects of group cohesion using generalised relational structures
Management consulting firm node colour codes group membershipnode size codes extent of cohesive beliefsties: “Who do you ask when you want to find out what is going on..?”
Functional, structural and cognitive interdependence Evidence for separable tendencies: structural logic of information seeking: hierarchical with differentiation in information seeking structural interdependence information ties within groups structural & functional interdependence shared beliefs within groups cognitive and functional interdependence shared beliefs within groups among those linked by an information tie cognitive, structural and functional interdependence
5: A dynamic perspectiveco-evolution of action, networks, settings
Dynamic models Suppose that Xij(t) are time-dependent relational variables At any moment t, suppose that there is a possible change in status for some randomly chosen Xij with a transition rate logistic(Q Q(zQ(x*ij(t)) - zQ(x(t)))) where: x(t) denotes the state of the network at time t; x*ij(t) equals x(t) but with the value of Xij(t) changed from xij(t) to 1-xij(t); is a rate parameter; logistic(z)=exp(z)/(1+exp(z)) Then this continuous-time Markov process converges to the distribution Pr (X= x) = (1/c) exp{QQzQ(x)} parameters can be estimated from longitudinal data (using approach adapted from that developed by Snijders, 2001, 2002)
Modelling client referrals Time 1 Time 2 Time 2 Time1Time2 PLE PLE cond MCMCMLE* cond estimate Edge -3.02 -3.20 - -2.74 (0.35) 2-in-star 0.01 0.05 0.06 (.03) 0.04 (0.03) 2-path -0.08 -0.07 -0.05 (.02) -0.05 (0.02) 2-out-star 0.09 0.10 0.08 (.02) 0.09 (0.02) mutual tie 2.54 1.73 1.72 (.29) 1.39 (0.28) 3-cycle -0.20 -0.14 -0.15 (.09) -0.14 (0.09) transitive triad 0.21 0.19 0.16 (.03) 0.14 (0.03) *using SIENA, conditioning on number of ties
Early 1990s in Brazil: student, civic, political and business groups time 1 time 2 time 3 -3.222(.44) -3.805( .44) -4.678( .46) -2.223(1.1) -6.665(1.8) -10.71(1.5) -4.405(.98) -6.333(1.5) -9.322(1.8) 0.099(.02) 0.116(.02) 0.170(.02) 0.123(.17) 0.734(.17) 1.051(.15) 0.198(.02) 0.207(.03) 0.202(.02) 0.204(.04) 0.309(.06) 0.459(.14) 0.745(.10) 0.886(.14) 0.906(.12) 0.320(.06) 0.443(.09) 0.444(.06) -0.177(.04) -0.123(.05) -0.022(.04) -0.461(.06) -0.307(.06) 0.000(.06) -0.146(.07) -0.041(.05) -0.024(.03) 0.808(.08) 0.472(.07) 0.139(.06) Key : organisation project event
6. Concluding comments Models can display complex behaviour (e.g. nonlinearities, phase transitions) creating some statistical difficulties! Nonetheless, a statistical approach allows us to stay close to empirical data, and model parameters can be estimated from data. For a well-specified model We can test hypotheses about local contextual effects We can predict the evolution of the system (and its variability) We can understand the aggregate-level consequences of local contextual effects (and their variability) Realisation-dependent models appear to be necessary, and reflect a “capacity for actors to transform as well as reproduce long-standing structures, frameworks and networks of interaction” (Emirbayer & Goodwin, 1994)
Some modelling challenges Scaling up: the role of space Spatial random graph models (Henry Wong) Co-evolution Dynamic interactions across levels Evolution of multiple networks Social “innovation” and transformation Multiple networks are implicated theoretically e.g Padgett et al on the evolution of markets in Florence “Emergent” phenomena? Eg emergence of social institutions such as groups Technical issues Sampling, estimation, missing data…