Download
1 / 59
790 likes | 1.72k Vues
PUBLIC CHOICE. Political decisions. Distribution of Financing Govt programs. Quality of Educational system. Quality of Road network. Commitment of Military forces. Amount of taxes. In democratic nation – citizens can vote on issues or for candidates to take positions.

E N D
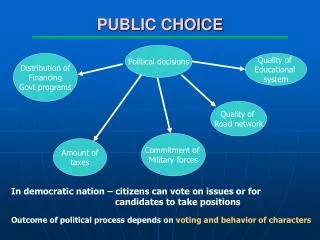
PUBLIC CHOICE Political decisions Distribution of Financing Govt programs Quality of Educational system Quality of Road network Commitment of Military forces Amount of taxes In democratic nation – citizens can vote on issues or for candidates to take positions Outcome of political process depends on voting and behavior of characters
Studies how decisions to allocate resources and redistribute income are made through a political system Examines how political Process is used to determine The quantity of goods And services supplied by govt THEORY OF PUBLIC CHOICE In economic perspective-purpose of politic is to provide useful goods and services Is influenced by ideology Most common public choice – majority rule
POLITICAL EQUILIBRIUM • Is an agreement on the level of production of one or more public goods given the specified rule for making collective choice and distribution of tax shares among individuals. • Tax shares or tax prices: • Are pronounced levies assigned to citizens • Are equal to a portion of the unit cost of a good proposed to be supplied by govt • Represent price per unit of a govt supplied good • Sum of tax shares (∑ti) = ave cost of public goods for all voters Where ti = tax share to individual i
POLITICAL EQUILIBRIUM • Cost of producing public goods influences the amount of taxes citizens must pay to finance production of each unit of the goods. • ↑ AC of ↑ individual’s tax bill public goods per unit of the good Note:Information on cost is difficult to obtain
POLITICAL EQUILIBRIUM • Political campaigns provide info on cost on cost and benefit of alternative programs being offered to voters for their consideration. • Control on info concerning cost and benefit of public goods is an important factor influencing collective choices and their efficiency • Actual outcome depend on particular public choice rule used to make decision • Simple majority rule : a proposal is approved > than ½ the vote cast if it received the smaller the Proportion of community required to approve Any given issue the greater the probability the issue will be approved.
ELECTION AND VOTING • Public choice made formally through elections – one individual allowed one vote • Assumptions: • People evaluate desirability of goods supplied by govt the same way they consider market goods and services • People vote in favor of a proposal only if they will be made better off by its passage
ELECTION AND VOTING Rational person’s most prefered political outcome • The quantity of govt supplied goods corresponds to the point at which person’s tax share = MB of the good • This level of output Q* provides the maximum possible satisfaction to that person • At output > Q* will make the person worse off.
Figure 5.1 The Most Preferred Political Outcome of A Voter Tax per Unit of Output Z ti Tax MB Q* 0 Output per Year A voter will vote in favor of any qty of public good as long as extra benefit exceed extra tax i Extra benefit > extra tax from extra unit voters must pay extra tax >extra benefit ↑ towards Q* will make voter better off ↑ beyond Q* will make voter worse off
THE CHOICE TO VOTE OR NOT • Decision to vote or not depend • on cost and benefit of doing so • Probability that voting help to achieve anticipated benefits • Whether people receive pleasure exercising the duties of being a citizen • Cost refers to – time, effort, cost to gather information (reading newspaper, attend meetings or gatherings) • Non-voters tend to be free-riders
THE CHOICE TO VOTE OR NOT • for nonvoters: • Cost of voting is positive • Expected benefits close to zero These are their rational for not voting • Democratic nation will not function as no one would vote. Thus voting is a legal requirement. • Voters less likely to vote when they see little or no difference between the alternatives considered in election.
THE CHOICE TO VOTE OR NOT • Voters avoid to vote due to scanty or poor information • To vote intelligently need information on MC (and extra taxes) incurred if the issue under consideration is passed. • Also need information on MB they may receive Information is hard and time consuming to obtain. This leads to rational ignorance (kejahilan rasional)
THE CHOICE TO VOTE OR NOT • Rational Ignorance is the idea that, to many voters, the MC of obtaining information concerning an issue is greater than the MB of gaining that information. • This leads the voter to fail to gather the information and then not to vote.
DETERMINANTS OF POLITICAL EQUILIBRIUM • the public choice rule • average and marginal costs of the public good • information available on the cost and benefit. Voters will compare the MC and MB of the product. • the distribution of the tax shares. As PG is financed by tax paid by citizens, they want to know their tax shares • distribution of benefits among voters. If the product produce fairer and more equitable distribution, voters will vote for them Changes in these factors will lead to changes in equilibrium
POLITICAL EQUILIBRIUM UNDER MAJORITY RULE • ASSUMPTIONS: • Citizen must decide quantity of pure public goods (PG) to produce • Given AC, tax sharing scheme is such that each individual pay same tax per unit of the good • Goods are produced at constant cost • An individual in the community , each pay tax = AC/n per unit PG
POLITICAL EQUILIBRIUM UNDER MAJORITY RULE Example: • Assume • 7 voters A, B, C, M, F, G, H constitute a committee trying to decide on security protection service • Quantity of protection changes with no of security guards hired • MC or AC per guard is $350 per week. Thus weekly tax share each voter/guard is $350/7 =$50 (AC/n) Therefore given tax share /guard individual’s most prefered output is where MB cross the tax line Since protection is PG, all must consume the same quantity of guards/week that can gain approval under majority rule.
Figure 5.2 : Political Equilibrium Under Majority Rule with Equal Tax Shares MC = AC E 350 SMB Marginal Benefit,Cost, and Tax (Dollars) t 50 MBG MBF MBH MBC MBM MBB MBA 0 1 2 3 4 5 6 7 Security Guards per Week Equilibrium occur at the most preferred outcome of 4 security guards /week In eqm the weekly tax bill of each voter is $200 Weekly tax bill of each voter $50/guard/week
ELECTIONS UNDER MAJORITY RULE • Elections will be held to approve or disapprove successive increases in the output of the public good • As long as a proposal to ↑ the amt of guards per week by 1 more unit achieves >½ the 7 votes, it will pass • Thus at least 4 votes are required for a proposal to pass (refer table 5.1) • Increases in output > 4 guards/wk will not receive a majority of votes. Most voters reached a level of consumption at which MB < their tax shares and thus vote NO.
Increase Security Guards per Week to: 1 2 3 4 5 6 7 Voters A Y N N N N N N B Y Y N N N N N C Y Y Y N N N N M Y Y Y Y N N N F Y Y Y Y Y N N G Y Y Y Y Y Y N H Y Y Y Y Y Y Y result Pass Pass Pass Pass Fail Fail Fail Voting to Provide Security Protection and Election Result under Simple Majority Rule
1) THE MEDIAN VOTER MODEL • The median voter (pengundi pertengahan) role is to determine optimal quantity of public goods as well as the equilibrium qty in a political process. • In fig 5.2 voter with MBM is the median voter • The Median voter model: assumes that the voter whose most-preferred outcome is the median of the most preferred political outcome of all those voting will become the political equilibrium.
1) THE MEDIAN VOTER MODEL • The median voter is defined as ‘the one whose most-preferred outcome is the median of the most-preferred outcome of all voters.’ • Median voter is NOT a particular person. • The identity of the median voter can change over time. For example, if all voters have the same most-preferred outcome, then any one of them can be regarded as the median voter.
1) THE MEDIAN VOTER MODEL • Under those circumstances, the political equilibrium under majority rule will be identical to the political equilibrium under unanimous consent. • The greater the dispersion of most-preferred outcomes from the median, the greater the dissatisfaction with political outcomes under majority rule.
1) THE MEDIAN VOTER MODEL • Implications of median voter model: • Only the median voter gets his most preferred outcome. (voter M consume the same amt of PG that she would choose to consume at a price t=$50 • Others get either too little or too much. • voters A, B, C consume > than most preferred levels of security protection • voters F, G, H ends up consuming < their most-preferred levels under the majority rule equilibrium)
2) POLITICAL EXTERNALITIES • Political externalities are losses in well-being that occur when voters do not obtain their most-preferred outcomes, given their tax shares. • PE=0 if tax shares of all voters = MB govt g & s • If PE prevails, additional gain to voters possible either by ∆govt output or ∆ tax shares
2) POLITICAL EXTERNALITIES • Political Ext ≠ market externalities • PE – costs borne by those who would like to have more or less of a govt g & s given their tax shares; amount agreed upon in through political interaction. • If decisions are made under unanimous agreement, PE would not exist.
3) POLITICAL TRANSACTION COSTS • Political transaction costs are the measures of the value of time, effort, or other resources expended to reach or enforce a collective agreement. • These are additional costs of the political process. • They must be considered in evaluating the efficiency of govt supply compared with market supply.
UNIQUENESS AND CYCLING OF OUTCOMES UNDER MAJORITY RULE • Under certain circumstances, a unique political eqm cannot emerge under majority rule • Thus there will be other alternative output level that can also achieve a majority • When there is no equilibrium, o/come of decisions will also depend on factors other than benefits of proposed change of output to voters: • The order in which alternatives are presented to voters • The addition or subtraction of an alternative to ballot
UNIQUENESS AND CYCLING OF OUTCOMES UNDER MAJORITY RULE • This implies: • Skillful politicians might be able to manipulate the result of election by controlling the order in which proposals are considered by the electorate.
UNIQUENESS AND CYCLING OF OUTCOMES UNDER MAJORITY RULE The problem of absence of political equilibrium exist when there is a multiple-peaked preferences. simple numerical example that shows that when one out of three voters has multiple-peaked preferences, there is no political equilibrium. This means that there is no one alternative that when placed on the ballot will dominate others. Each winner can be paired with some other alternative and lose. This is the phenomenon of cycling.
UNIQUENESS AND CYCLING OF OUTCOMES UNDER MAJORITY RULE • Example- community of 3 citizens must vote to decide no of fireworks displays/yr • Each display cost $200: • Voter A tax share tA = $100/display • Voter B tax share tB = $75/display • Voter C tax share tC = $25/display • 3 alternatives – one display, two displays or three displays per year. • Decision determined by simple majority rule.
VOTER RANKING FOR FIREWORK DISPLAYS PER YEAR Given tax shares, voters rank these alternatives in terms of highest to lowest levels of net benefits received. A - her net benefit increases with no of displays/yr B - obtain greatest net benefit with one display is provided per yr C - obtain greatest net benefit with two displays are provided per yr
A. SINGLE PEAKED PREFERENCES(KEGEMARAN PUNCAK TUNGGAL) • implies individual behave as if a unique optimal outcome exists for them. • The further away from their optima, either in the positive or negative direction, the worse things • Voters A and C both have single-peaked preferences: • If output reduced below 3 displays/yr, voter A is made continually worse-off • If displays per year deviate in any direction from C’s most preferred outcome of two, she is made worse off.
A. SINGLE PEAKED PREFERENCES(KEGEMARAN PUNCAK TUNGGAL) Single-peaked preferences imply that : there is one alternative that the voter prefers to all others and that he or she is made worse off if either more or less of the most-preferred output is supplied. • When all voters have single-peaked preferences, there can be no cycling. In the example, two fireworks displays per year is the political equilibrium.
A. SINGLE PEAKED PREFERENCES(KEGEMARAN PUNCAK TUNGGAL) • This means that whenever it appears on the ballot, it will defeat the alternative with which it is paired. The political equilibrium under majority rule in this case is always the median most-preferred outcome. This is the median peak of all the net benefit functions
B. MULTIPLE PEAKED PREFERENCES(KEGEMARAN PUNCAK BERGU) • As people move away from the most preferred outcome, they become worse off until a certain point . • After that point, as they move further away from their most-preferred outcome they become better off. • example – B is the only one with multi-peaked preferences (refer to fig 5.3) B becomes worse off as firework displays increased from 1 to 2 /yr but they are better off as output increased from 2 to 3
FIGURE 5.3 VOTER RANKINGS OF ALTERNATIVES Multiple Peaks Single Peak Net Benefit for B Net Benefit for A 0 1 2 3 0 1 2 3 Fireworks Displays per Year Single Peak Single Peak Net Benefit for C Net Benefit for B’ 0 1 2 3 0 1 2 3 Fireworks Displays per Year
PAIR WISE ELECTIONS: THE PHENOMENON OF CYCLING • Pair-wise elections are those held between any two alternatives when 3 or more alternatives are possible. • Example – voter is presumed to vote for the alternative that gives the highest net benefit • In election 1: • 2 displays receive 2 votes vs 1 vote for 1 display, it receives simple majority and thus declared the winner.
PAIR WISE ELECTIONS: THE PHENOMENON OF CYCLING Pairwise cycling is a phenomenon in which each outcome can win a majority depending on how it is paired on a ballot. RESULT : 2 DISPLAYS PER YEAR WINS
PAIR WISE ELECTIONS: THE PHENOMENON OF CYCLING Next pair-wise: election between losing Alternative of one display and remaining Alternative of 3 displays last pair-wise: election between losing Alternative of 3 display and alternative of 2 displays RESULT : 1 DISPLAY PER YEAR WINS RESULT : 3 DISPLAYS PER YEAR WINS
PAIR WISE ELECTIONS: THE PHENOMENON OF CYCLING • RESULT OF PAIR-WISE VOTING IS A NEVER-ENDING CYCLE.Each loser can become a winner when paired with another alternative. • The outcome of the election between pairs of alternatives is arbitraty. • Depending on the order in which elections are held, any 3 alternatives can emerge as winner. This is called cycling • In pair-wise elections, no political equilibrium exists. No alternative can defeat all others wherever it appears on the ballot
ARROW’S IMPOSSIBILITY THEOREM According to Arrow’s Theorem: • It is impossible to devise a voting rule that meets a set of conditions that can guarantee a unique political equilibrium for a public choice
CONDITIONS OF ARROW’S IMPOSSIBILITY THEOREM • All voters have free choice, no dictator • We cannot rule out multi-peaked preferences • If all voters change their rankings of a particular alternative, the public choice that emerges must not move in the opposite direction.
CONDITIONS OF ARROW’S IMPOSSIBILITY THEOREM • Public choices are not influenced by the order in which they are presented • Public choices must not be affected by the elimination or additionof alternatives to the ballot • Public choice, like all economic choices should be transitive.
Medium Peak (Voter C) Peak for Voter B' Peak for Voter A FIGURE 5.4 : THE MEDIAN PEAK AS THE POLITICAL EQUILIBRIUM UNDER MAJORITY RULE Net Benefit 0 1 2 3 Fireworks Displays per Year
CAUSE OF CYCLING ELECTORAL TALLY SHEETS FOR PAIRWISE . RESULT : 2 DISPLAYS PER YEAR WINS
Logrolling or Vote Trading • Logrolling is the act of voting for something you would ordinarily vote against so that someone else will vote for something that they would ordinarily vote against. • This is typically done when people care deeply about passage of their issue and less about other issues.
Implicit Logrolling • Implicit logrollingoccurs when political interests succeed in pairing two (or more) issues of strong interest to divergent groups on the same ballot or the same bill. • The willingness of each special-interest group to vote for the combined package is a function of the relative intensity of preference on the two issues.
State Government Spending and the size of the Legislature • The theory of logrolling suggests that, as more districts are available to distribute the costs of public spending, there will be more incentives for individual legislators to engage in vote trading to expand state government spending. • Researchers found a positive relationship between the size of the state Senate and spending.
Figure 5.8 Logrolling A B 300 MC 300 MC 250 Marginal Benefit, Cost, and Tax (Dollars) Marginal Benefit, Cost, and Tax (Dollars) 250 MBA MBC 100 100 t t MBB MBC 0 1 0 1 MBA MBB Fireworks Displays per Week MC = MSC 600 500 Marginal Benefit, Cost, and Tax (Dollars) C SMB 250 t 200 MBC MBB MBA 0 1 Security Guards and Fireworks Displays per Week
Special Interests • Special Interests are groups that lobby on particular issues. • An example of a special interest is unions and/or steel companies lobbying for Tariffs and Import Quotas to protect their jobs or profits. • Efficiency losses per job saved almost always exceed the pay of the retained worker. • Estimates of the net effect run between –$9000 and –$38,000