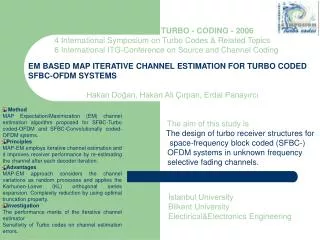
Turbo Codes
Turbo Codes. Presented By : Muhammad Jameel. Presentation Outline. Encoder and Convolutional Codes. The figure illustrates Convolutional encoder with constraint length ‘K’ Code rate of the encoder shown is 1/2


Turbo Codes
E N D
Presentation Transcript
Turbo Codes • Presented By : • Muhammad Jameel
Encoder and Convolutional Codes • The figure illustrates Convolutional encoder with constraint length ‘K’ • Code rate of the encoder shown is 1/2 • The output switch samples the output of each modulo-2 adder (First, the upper adder second, lower adder),thus forming the code symbol pair making up the branch word. • The sampling is repeated for each inputted bit
Encoder (Cont’d) • The figure illustrates the state transition Diagram for the previous Convolutional encoder • The state is represented by ‘K-1’ registers status
Encoder (Cont’d) • The figure on the Left is the Tree Diagram of the Coder • This figure lacks the time information and also at later stages the branches are being repeated • The figure on the Left is the Trellis Diagram of the Coder • This is the compact representation of Coder including both the state and time information
Interleaver • The types of Interleaver are (1) Block Interleaver (2) Convolutional Interleaver • The Block Interleaver accepts the coded symbols in blocks, permutes the symbols and then feeds the rearranged symbols to the modulator • In Convolutional Interleaver the codes symbols are sequentially shifted into the Bank of N registers; each successive register provides J symbols more storage than the previous one.
Interleaver (Block Interleaver ) • The figure in the Left is the Block Interleaver with Rows = 4 and Column = 6. After the array is completely filled, the symbols are then fed to the Modulator one row at a time and transmitted over the channel. • At the Receiver, the Deinterleaver performs the reverse operation; Symbols are entered in the Deinterleaver array by rows and removed by columns
Interleaver (Convolutional Interleaver) • The zeroth register provides no storage. • With each new symbol the commutator switches to a new register and the new code symbol is shifted in, while the oldest code symbol in that register is shifted out to the Modulator / Transmitter • The advantage of Convolutional Interleaving is the reduction of half in delay and memory over block interleaving requirements.
Turbo Encoder Recursive Systematic Code(RSC) • RSC codes are so called because previously encoded bits are continually fed back to the encoder input. • for high code rates RSC codes result in better error performance.
Turbo Encoder • The following is the Turbo encoder diagram. It is basically the concatenation of two parallel RSC coders. The switch {vk} provides puncturing thus reducing the code rate to ½.
Decoding Algorithm Soft and Hard Decisions • In a binary demodulation system there are two equally likely signals S1(t) and s2(t). • To make the binary Maximum Likelihood decision given a signal meant to decide that S1(t) was transmitted if p(z/S1) > p(z/S2) otherwise to decide that S2(t) was transmitted. • When the quantized level of demodulator output is two, the decoding is called as Hard Decision Decoding. When it is more than two, the decoding is called as Soft Decision Decoding • In Soft Decoding as shown in figure, the 8-level soft decision metric is known as -7,-5,-3,-1,1,3,5,7. The sign of the metric represents a decision(e-g Choose S1 if positive and choose S2 if negative), and the magnitude of metric represents the confidence level of that decision.
Viterbi Decoding Algorithm • Viterbi algorithm uses decoder trellis diagram for decoding the received sequence. It performs Maximum Likelihood Decoding • The algorithm removes from consideration those trellis paths that could not possibly be the candidates for maximum likelihood choice. • When two paths enter the same state, the one having the best metric is chosen and this path is called as the surviving path. • The decoder continues to move in this way deeper into the trellis and the selection of surviving paths is performed on all states.
Soft-Decision Viterbi Algorithm SOVA • The primary difference between Hard decision and Soft decision Viterbi algorithm is that the Soft decision algorithm cannot use a hamming distance metric because of its limited resolution. • The distance metric with the needed resolution is Euclidean distance and to facilitate its use the binary numbers 1 and 0 are transformed into the octal numbers 7 and 0 respectively.
Maximum a posteriori Probability (MAP) Algorithm • Consider the two signal case, ‘d’ represents the transmitted data bit. The figure shows the conditional pdf’s referred to as Likelihood functions. • A line subtended from xk intercepts the two Likelihood functions yielding two Likelihood values • The hard decision rule , Maximum Likelihood , chooses 1 or 0 based on the magnitude comparison of l1 and l2 • Another rule, maximum a posteriori Probability(MAP) says that • One should choose Hypothesis H1, (d = +1) if the APP, p(d = +1/x) is greater than APP, p(d = -1/x) and vice versa for H2 • Using bay’s rule we get the Likelihood ratio ;
Maximum a posteriori Probability (MAP) Algorithm • The Log Likelihood Ratio (LLR) of the Decoder is given as • The output equation has three elements --- a channel measurement, a priori knowledge of the data and an extrinsic LLR stemming solely from the decoder. • The sum of two Log Likelihood Ratio is defined as
Maximum a posteriori Probability (MAP) Algorithm • A demodulator is often designed to produce soft decisions to the decoder • The final decoding process out of the decoder must terminate in bits (Hard Decision). • Turbo decoding involves feeding outputs from one decoder to the inputs of other decoder in an iterative fashion, so decoding of turbo codes is a Soft input/ Soft output decoder . The extrinsic likelihood is fed back to serve as a refinement of the a-priori probability of the data for next iteration.
Maximum a posteriori Probability (MAP) Algorithm • The ratio of the APP, also called as the Likelihood ratio or its Logarithm called as the Log-Likelihood ratio are given as; • Where is called as the joint probability of • The R1 is the corrupted received sequence after it has been transmitted through the channel • Using the Bay’s rule we have the equation
Maximum a posteriori Probability (MAP) Algorithm • Forward State Metric: • Reverse State Metric: • Branch Metric: • So, replacing these values we get;
Maximum a posteriori Probability (MAP) Algorithm • Forward State Metric (Simplified): • Reverse State Metric(Simplified): • Branch Metric(Simplified): • So, replacing these values we get;