Longitudinal Study of Response Times in Children with Specific Language Impairment
This study replicates previous findings on response time (RT) differences between children with Specific Language Impairment (SLI) and their typically developing peers. Conducted on a subset of children previously tested in third grade, results indicate that by eighth grade, SLI children remain 21% slower than those with normally developing language (NLD), compared to a 14% difference noted in earlier testing. The study aims to examine the consistency of processing speed across grades and will expand to analyze subgroup differences in future research, enhancing our understanding of SLI.

Longitudinal Study of Response Times in Children with Specific Language Impairment
E N D
Presentation Transcript
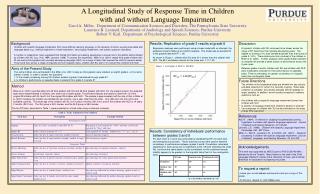
Figure 1. Scatterplot of NLD vs. SLI RTs RTSLI = 1.21(RTNLD) A Longitudinal Study of Response Time in Children with and without Language ImpairmentCarol A. Miller, Department of Communication Sciences and Disorders, The Pennsylvania State UniversityLaurence B. Leonard, Department of Audiology and Speech Sciences, Purdue UniversityRobert V. Kail, Department of Psychological Sciences, Purdue University Background Children with specific language impairment (SLI) have difficulty learning language, in the absence of factors usually associated with language delay (e.g., hearing impairment, mental retardation, neurological impairment, and autistic spectrum disorders). A number of researchers have suggested that limited information processing speed plays a causal role in the deficits demonstrated by children with SLI (e.g., Kail, 1994; Leonard, 1998). To assess this hypothesis, Miller et al. (2001) tested third grade children with SLI as well as third graders with normally developing language (NLD) on a range of tasks that required the child to respond rapidly. They found that, across a range of linguistic and non-linguistic tasks, children with SLI were 14% slower than children with NLD. Results: Replication of grade 3 results at grade 8 Regression analyses were performed, using a linear model with no intercept, the preferred model in Miller et al.’s (2001) analysis. The model was an excellent fit to the grade 8 data with R2 = .95. As shown in Figure 1, children with SLI were 21% slower than the children with NLD. The 95% confidence interval for the slope was 1.17-1.25. Discussion At grade 8, children with SLI continued to be slower across the range of RT tasks than their typically-developing peers. The degree of slowing (21%) was somewhat greater than that found at grade 3 (14%). These data come from a subset of the children in Miller et al. (2001). Further analyses when grade 8 data collection is complete will provide a better picture of performance across the 5-year span. Between grades 3 and 8, children with SLI and children with NLD were moderately consistent in their performance on speeded tasks. There is a tendency for greater consistency on linguistic tasks than nonlinguistic tasks. Aims of the Present Study The same children who participated in the Miller et al. (2001) study as third-graders were retested, as eighth graders, on the same battery of tasks, in order to answer two questions. 1. Is the slower processing among SLI children evident at grade 3 maintained through grade 8? 2. Is children’s performance on speeded tasks consistent from grade 3 to grade 8? • Future Directions • The children in the longitudinal study are divided into two cohorts, and data collection for cohort 2 is currently ongoing. When data collection is complete, the present analyses will be repeated on larger samples. In addition, we will conduct analyses to address questions such as: • Are children with nonspecific language impairment slower than children with SLI? • Is severity of language impairment related to degree of slowing? • Can subgroups of children with SLI be discriminated on the basis of their RTs over time? Method Miller et al. (2001) reported data from 29 third graders with SLI and 29 third graders with NLD. For the present project, the speeded tasks were readministered to children, who were now in eighth grade. The present analyses are based on data from 13 of the original 29 children with SLI and 14 of the original 29 children with NLD. The sample is approximately half the size of that in Miller et al. (2001) because the children are divided into two cohorts, one a year older than the other. Only data from the first cohort are available currently. The mean age of the children with SLI is 14 years 0 months (SD 3 mo) and of the children with NLD is 14 years 2 months (SD 2 mo). The SLI group is 54% female, and the NLD group is 36% female. The ten RT tasks, described in Table 1, were presented in a fixed order using a notebook computer. References Kail, R. (1994). A method for studying the generalized slowing hypothesis in children with specific language impairment. Journal of Speech and Hearing Research, 37, 418-421. Leonard, L.B. (1998). Children with Specific Language Impairment. Cambridge, MA: MIT Press. Miller, C., Kail, R., Leonard, L.B., & Tomblin, J.B. (2001). Speed of processing in children with specific language impairment. Journal of Speech, Language, and Hearing Research, 44, 416-433. Results: Consistency of individuals’ performance between grades 3 and 8 For each child, a z-score was computed by standardizing RTs for each task, and averaging across tasks. These summary scores were used to examine consistency in performance between grades 3 and 8. Correlations calculated separately for each group are not significant at the .05 level (reflecting the small Ns), but show the same pattern as the correlations for the combined sample: stability appears to be greater for the linguistic tasks than for the nonlinguistic tasks. Acknowledgements This work was supported by NIDCD grant 2 P50 DC02746-06A1, directed by Bruce Tomblin. Many thanks to the staff of the Child Language Research Center at the University of Iowa, and to Daniel Britchkow for assistance in preparing the poster. • To request a reprint: • Leave your e-mail address and we will e-mail you a copy of this poster. • E-mail your request to: cam47@psu.edu * p < .01, all other correlations p > .05