Download
1 / 28
280 likes | 459 Vues
URBP 204A QUANTITATIVE METHODS I Survey Research I. Gregory Newmark San Jose State University (This lecture is based on Chapters 7, 9 & 10 of Earl Babbie’s The Practice of Social Research, 10 th Edition . All cartoons are from CAUSEweb.org by J.B. Landers.). Populations and Samples.

E N D
URBP 204A QUANTITATIVE METHODS ISurvey Research I Gregory Newmark San Jose State University (This lecture is based on Chapters 7, 9 & 10 of Earl Babbie’s The Practice of Social Research, 10th Edition. All cartoons are from CAUSEweb.org by J.B. Landers.)
Populations and Samples • Populations • All the people in a specified group of people • The population of Students at SJSU • The population of Students in Urban Planning at SJSU • The population of Students in 204A this semester • Samples • A portion of a larger population selected for study • A 500 person Sample of Students at SJSU • A 50 person Sample of Students in Urban Planning • A 15 person Sample of Students in 204A this semester
Populations and Samples • Ideally, research covers entire populations • “Medicine X always cures the common cold” • Financially, research is expensive • “We can’t afford to test Medicine X on everyone” • Practically, we test samples of a population • “We can afford to test Medicine X on 1,000 people” • Hopefully, those samples well represent the actual population • “For our results to be generalizable, our 1,000 people should approximate the characteristics of everyone”
Populations and Samples • Sampling Error • A measure of how well a sample approximates the characteristics of the larger population • The difference between a sampling statistic (i.e., values in the sample) and a population parameter (i.e., values in the population) • Low sampling error means higher precision • Higher precision means more generalizability • Valuable research has a high degree of generalizability
Sampling Say we want to sample the students at SJSU, how do we pick our sample?
Sampling • Bias occurs when the sample is not representative of the population • “We sampled students exiting the gym and found that SJSU students have a high level of fitness” • “We sampled students from 6 to 9 pm and found that most SJSU students work full time” • “We sampled students at Burger King and found that very few SJSU students are vegetarian” • How can we avoid bias?
Probability Sampling Samples selected in accord with probability theory, typically using random selection All members of population have an equal chance of being selected for sample In theory, removes bias from sample
Probability Sampling • In practice, several types of bias remain possible • Non-response Bias • Some people can not or will not answer the survey • If their traits vary from responders, bias occurs • Coverage Bias • If members of population are not in sampling frame • E.g. people without telephones in a telephone survey • Selection Bias • If members have a different probability of selection • E.g. people with multiple lines in a telephone survey
Probability Sampling • Samples never perfectly ‘representative’ but we can estimate how close they are • We exploit the fact that the sample averages are normally distributed • Example • Then we take the standard deviation of those averages which we call the standard error (SE)
Probability Sampling • Calculate standard (sampling) error • This is the Standard Deviation divided by the square root of the sample size (we use the SD of the sample rather than the population) • We report our confidence level that the actual population parameter is within a given range from the sampling statistic
Probability Sampling • Example: Neighborhood of 10,000 households • What is the mean household income? • Population Parameter (‘true’ value for population) • $50,000 • Survey incomes from a sample of 100 households • Sampling Statistic (value for the sample) • $49,000 with an SD of $10,000 • Calculate the standard error (SE) • $1,000 = $10,000 / 10
Probability Sampling • Example: Neighborhood of 10,000 households • Define our confidence level, • 95% Confidence Level • Define the associated confidence interval • 95% Confidence Level is associated with 2 standard errors • Each standard error is $1,000 • Confidence interval would be from $47,000 to $51,000 • We are 95% confident that the true mean income falls between $47,000 and $51,000 • Margin of Error = half the range of the confidence interval • We are 95% confident the true mean income is $49,000 ± $2,000
Probability Sampling Bad pun on margin of error
Probability Sampling Which faux movie is expressed as a confidence interval?
Probability Sampling Why is there no margin of error here?
Probability Sampling Why might the confidence interval be good to know?
Probability Sampling • Sampling Designs • Simple Random Sampling • Everyone assigned a number, random cases selected • Systematic Sampling – “Every 7th household. . .” • Every kth person chosen • Sampling Ratio – is the proportion of population selected • Problem of periodicity (e.g. apartments, army units) • Stratified Sampling – “Stratified by age group . .” • Groups units into homogenous ‘strata’ before sampling • Improves representativeness, in terms of ‘strata’ • Cluster Sampling – “Only certain schools selected” • Multistage approach • Natural clusters selected first and then subsampled
Non-Probability Sampling • Sampling error can not be statistically estimated • Data only tells us about who was surveyed • Approaches: • Judgment Samples: used for targeting surveys • Researcher decides whom to include • Snowball Samples: used for rare populations • Respondents recommend other respondents • Quota Samples: common for market research • Sample designed to include a designated number of people with certain specified characteristics • Convenience Samples: such as an in-class survey • Sample includes whomever most easily accessed
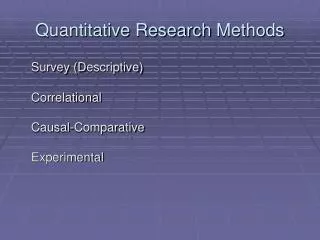
Modes of Observation Surveys Experiments Qualitative Field Research Others ( for example, content analysis)
Surveys • Strengths • Describe characteristics of a large population • Make large samples feasible • More flexible – can cover several topics • Strong on reliability • Weakness • Least common denominator • Life situation/ context not known • Inflexible - can not change questions mid-way • Respondent may form opinion at the moment • Weak on validity
Surveys • Design elements • Questions and statements • Open vs. Closed Ended Questions • Avoid double barreled questions – check the use of ‘and’ • Make items clear and cogent • Be very specific, e.g. income last year based on tax return • Respondent must be competent • Don’t ask a brain surgeon about rocket science • Respondent must be willing to answer • “Are you having an affair?” • Avoid negative items and biased phrasing
Surveys • Guidelines for survey interviewing • Modest yet neat appearance • Avoid voice inflections • Be neutral • Be polite • Be familiar with the questions • Don’t add your words to the question • Record responses exactly • Gently probe for responses / clarifications
Surveys • Guidelines for survey form design • Not cluttered • Professional look • Clear instructions on how to choose responses • Consider having introductory comments • Use of contingency questions • “if yes to Question 7, ask Question 7a” • Use of matrix format • Order of questions • Do not bias due to the order • In self- administered begin with interesting questions • In interviews begin with uncomplicated questions • Pretest the questionnaire
Surveys • Self- administered Questionnaire • Mail (home delivery or combination) • Monitor the return • Follow up mailings • Questionnaire at a public gathering • Telephone Surveys • Unlisted number – random digit dialing • Advantages – • cheap and quick; no dress code; safety • probe more sensitive areas; • more quality control possible as central location • Disadvantages – • compete with bogus surveys; easy to hang up; • answering machines; cell phones