Download
1 / 10
140 likes | 537 Vues
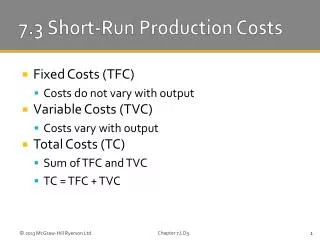
7.3 Short-Run Production Costs. Fixed Costs (TFC) Costs do not vary with output Variable Costs (TVC) Costs vary with output Total Costs (TC) Sum of TFC and TVC TC = TFC + TVC. Table 7-2 Total-Cost, Average-Cost, and Marginal-Cost Schedules for an Individual Firm in the Short Run. $1100.

E N D
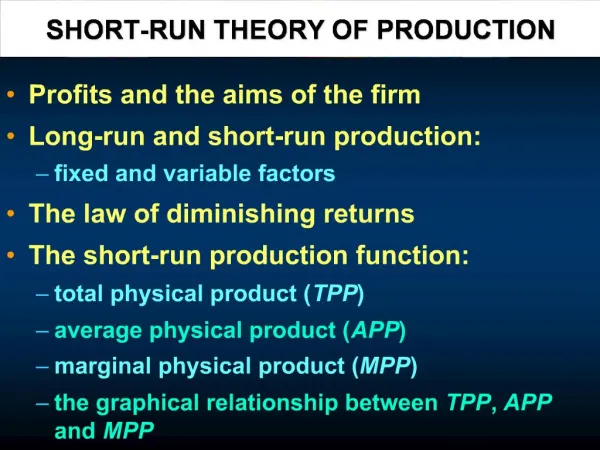
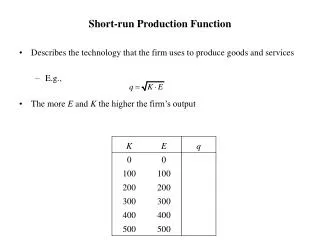
7.3 Short-Run Production Costs • Fixed Costs (TFC) • Costs do not vary with output • Variable Costs (TVC) • Costs vary with output • Total Costs (TC) • Sum of TFC and TVC • TC = TFC + TVC Chapter 7,LO3
Table 7-2Total-Cost, Average-Cost, and Marginal-Cost Schedules for anIndividual Firm in the Short Run Chapter 7,LO3
$1100 1000 900 800 700 600 Costs 500 400 300 200 100 0 10 1 2 3 4 5 6 7 8 9 Q Figure 7-3 Total Cost Is the Sum of Fixed Cost and Variable Cost TC TVC Fixed Cost Total Cost Variable Cost TFC Chapter 7,LO3 7-3
Per-Unit, or Average, Costs • Average Fixed Costs AFC = TFC/Q • Average Variable Costs AVC = TVC/Q • Average Total Costs ATC = TC/Q • Marginal Costs MC = ΔTC/ΔQ Chapter 7,LO3
$200 150 100 Costs 50 0 10 1 2 3 4 5 6 7 8 9 Q Figure 7-4 The Average-Cost Curves ATC AVC AFC AVC AFC Chapter 7,LO3
$200 150 100 Costs 50 0 10 1 2 3 4 5 6 7 8 9 Q Figure 7-5 The Relationship of the Marginal-Cost Curve to the Average-Total-Cost and Average-Variable-Cost Curves MC ATC AVC AFC AVC AFC Chapter 7,LO3
Figure 7-6 The Relationship between Productivity Curves and Cost Curves Average Product and Marginal Product Cost (Dollars) Production Curves AP MP Quantity of Labor MC AVC Cost Curves Quantity of Output Chapter 7,LO3
Relation of MC to AVC and ATC • When MC < current ATC • ATC will fall • When MC > current ATC • ATC will rise • MC intersects ATC and AVC at minimum points Chapter 7,LO3
Shifts of Cost Curves • Factor Prices • Price of fixed input increases... • AFC and ATC shift up • AVC and MC unchanged • Price of variable input increases... • AVC, ATC, and MC shift up • AFC unchanged Chapter 7,LO3
Shifts of Cost Curves • Technology • Improved technology • Lower costs • Cost curves shift down • Curve shifts depend on whether technology affects FC, VC, or both Chapter 7,LO3