Download
1 / 44
490 likes | 682 Vues
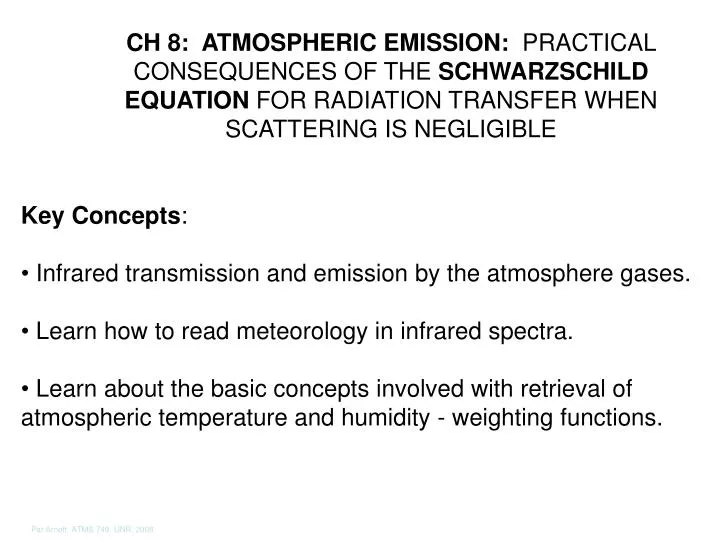
CH 8: ATMOSPHERIC EMISSION: PRACTICAL CONSEQUENCES OF THE SCHWARZSCHILD EQUATION FOR RADIATION TRANSFER WHEN SCATTERING IS NEGLIGIBLE. Key Concepts : Infrared transmission and emission by the atmosphere gases. Learn how to read meteorology in infrared spectra.

E N D
CH 8: ATMOSPHERIC EMISSION: PRACTICAL CONSEQUENCES OF THE SCHWARZSCHILD EQUATION FOR RADIATION TRANSFER WHEN SCATTERING IS NEGLIGIBLE • Key Concepts: • Infrared transmission and emission by the atmosphere gases. • Learn how to read meteorology in infrared spectra. • Learn about the basic concepts involved with retrieval of atmospheric temperature and humidity - weighting functions.
Some Energy States of Water Molecules http://www.lsbu.ac.uk/water/vibrat.html http://en.wikipedia.org/wiki/Libration
Atmospheric Transmission: Beer’s Law: I(x)=I0e(-abs x) What are the main sources for each gas? Which gases are infrared active and contribute to greenhouse warming? Which gases significantly absorb solar radiation? Gas concentrations from ‘typical’ midlatitude summer atmosphere. Nitrous oxide is emitted by bacteria in soils and oceans, and thus has been a part of Earth's atmosphere for eons. Agriculture is the main source of human-produced nitrous oxide: cultivating soil, the use of nitrogen fertilizers, and animal waste handling can all stimulate naturally occurring bacteria to produce more nitrous oxide. The livestock sector (primarily cows, chickens, and pigs) produces 65% of human-related nitrous oxide. [1] Industrial sources make up only about 20% of all anthropogenic sources, and include the production of nylon and nitric acid, and the burning of fossil fuel in internal combustion engines. Human activity is thought to account for somewhat less than 2 teragrams of nitrogen oxides per year, nature for over 15 teragrams.
Optics of N identical (particles / volume) Light beam area = A z dz z+dz Power removed in dz: = I(z) N A dz ext Bouger-Beer “law” (direct beam only!)
CH 8: ATMOSPHERIC EMISSION: PRACTICAL CONSEQUENCES OF THE SCHWARZSCHILD EQUATION FOR RADIATION TRANSFER WHEN SCATTERING IS NEGLIGIBLE What process subtracts radiation? What process adds radiation? What equation is used to calculate optical depth for a gaseous atmosphere?
FTIR Radiance: Atmospheric IR Window 13 microns 8 microns
DEFINITION OF THE BRIGHTNESS TEMPERATURETB Measured Radiance at wavenumber v = Theoretical Radiance of a Black Body at temperature TB
Atmosphere Emission Measurements, Downwelling Radiance Notes: Wavelength range for CO2, H20, O3, CH4. Envelope blackbody curves. Monster inversion in Barrow. Water vapor makes the tropical window dirty.
Ideal Weighting Function Wi: Where in the atmosphere the main contribution to the radiation at wavenumber i comes from.
Downwelling Intensity Emitted by the Atmosphere to the Detector (Radiance) =cos B[T(z)] emissivity=absdz/cos z dz q blackbody radiance, T = temperature. q ftir transmission emission weighting function
Weighting Functions for Satellite Remote Sensing using the strong CO2 absorption near 15.4 um. (from Wallace and Hobbs, 2nd edition)
Calculate and plot weighting functions as in the previous slide, but for the FTIR spectrometer at the ground looking up.(500 to 850 cm-1 region). Explain in detail, using these weighting function, how we can diagnose the temperature inversion in the Barrow Alaska graph. Bring questions to class related to how this is done. Extra credit: Calculate and plot weighting functions for the stratospheric ozone emission spectral region in the atmospheric window region (spectral region between 1000 and 1100 cm-1.) Chapter 8 Homework:
Simple Theory for W(z) at the Ground Where is the HUGE approximation? Why?
Simple Theory for W(z) at the Ground Where is the HUGE approximation? Why?
http://www.spectralcalc.com/calc/spectralcalc.php volume mixing ratio = 0.01 (CO2) = 0.1 (others)
http://www.spectralcalc.com/calc/spectralcalc.php Can save text file! volume mixing ratio = 0.01 (CO2)
Calculate the absorption cross section per molecule from the transmittance calculations and this theory.
abs0, P=1013.25 mb, T=296 K. ONLY CO2!!! =0.5 cm-1. 380 ppm CO2
http://www.spectralcalc.com/atmosphere_browser/atmosphere.phphttp://www.spectralcalc.com/atmosphere_browser/atmosphere.php Calculate N(z), then NH20(z), Nco2(z), etc. Calculate abs(z) depth. Calculate W(z)
Weighting Functions for the FTIR at the Ground Looking Up H=6 km
Weighting Functions for the FTIR at the Satellite Looking Down H=6 km
Theoretical Absorption Cross Sections for the indicated gases, averaged to 1 cm-1 resolution for clarity.
Theoretical Absorption Cross Sections for the indicated gases, averaged to 1 cm-1 resolution for clarity.
RENO FTIR SPECTRA Which day is more moist? Which day is warmer near the surface?
Comments on Figure 8.3. The very strong CO2 line at 15 microns typically gives the gas temperature closest to the FTIR spectrometer.
FTIR Data from the NASA ER2 with Responsible Gases labeled. IR Window 8-13 microns. IR radiation from the Earth’s surface escapes to space (cooling the Earth). Absorption by O3 near 9 microns ‘dirties’ the window. (From Liou, pg 120).
Atmospheric Temperature Profile: US “Standard” Atmosphere. Cirrus cloud level. High cold clouds, visible optical depth range 0.001 to 10, emits IR to surface in the IR window. From Liou
Cirrus Clouds: Small Crystals at Top, -40 C to -60 C nucleation Growth and fall Evaporation
FTIR Data from the NASA ER2, Clear and Cloudy Sky. (From Liou’s book). The ice cloud with small ice crystals has emissivity << 1, so the ground below is partially seen. Clouds reduce the IR making it to space in the atmospheric window region. IR Atmospheric window region
Ice Refractive Index Red shows the atmospheric window region. The resonance in the window region is useful for remote sensing. The real part goes close to 1, making anomalous diffraction theory a fairly reasonable approach for cross sections.
Cloud Emissivity in General and Zero Scattering Approximation.
Cirrus with Small Crystals IR Transmission Model Message: Curve has basic shape of the IR spectrum for small cirrus, primarily a transmission problem of ground radiance through the cloud, with a small emission correction. ASSUMES ZERO SCATTERING.
Cirrus with Small Crystals IR Emission Model Message: Curve has basic shape of the IR spectrum for small cirrus, primarily a transmission problem of ground radiance through the cloud, with a small emission correction.
IR Cooling Rates(from Liou) Message: Clouds are good absorbers and emitters of IR radiation. MLS is a moist midlatitude profile, SAW is a dry subarctic winter profile. Cooling rate is from the vertical divergence of the net irradiance absorbed and emitted.